September 18, 2013

ITM Cup Predictions for Round 6

Team Ratings for Round 6

Here are the team ratings prior to Round 6, along with the ratings at the start of the season. I have created a brief description of the method I use for predicting rugby games. Go to my Department home page to see this.

Here are the team ratings prior to this week’s games, along with the ratings at the start of the season.

Current Rating Rating at Season Start Difference
Canterbury 22.22 23.14 -0.90
Wellington 10.85 6.93 3.90
Auckland 7.52 9.02 -1.50
Counties Manukau 3.95 4.36 -0.40
Waikato 2.60 5.25 -2.70
Tasman -1.16 -6.29 5.10
Bay of Plenty -2.98 -1.96 -1.00
Taranaki -3.09 3.92 -7.00
Otago -3.59 -4.44 0.80
Hawke’s Bay -5.00 -6.72 1.70
North Harbour -6.52 -7.43 0.90
Northland -7.85 -8.26 0.40
Manawatu -9.45 -8.97 -0.50
Southland -10.77 -11.86 1.10


Performance So Far

So far there have been 38 matches played, 30 of which were correctly predicted, a success rate of 78.9%.

Here are the predictions for last week’s games.

Game Date Score Prediction Correct
1 Taranaki vs. Hawke’s Bay Sep 11 23 – 10 7.80 TRUE
2 Wellington vs. Bay of Plenty Sep 12 33 – 16 18.60 TRUE
3 Manawatu vs. Southland Sep 13 27 – 17 5.00 TRUE
4 North Harbour vs. Tasman Sep 13 23 – 12 -3.10 FALSE
5 Waikato vs. Auckland Sep 14 42 – 24 -3.90 FALSE
6 Canterbury vs. Otago Sep 14 32 – 22 34.20 TRUE
7 Counties Manukau vs. Taranaki Sep 15 44 – 7 6.70 TRUE
8 Hawke’s Bay vs. Northland Sep 15 31 – 26 7.80 TRUE


Predictions for Round 6

Here are the predictions for Round 6. The prediction is my estimated expected points difference with a positive margin being a win to the home team, and a negative margin a win to the away team.

Game Date Winner Prediction
1 Bay of Plenty vs. Southland Sep 18 Bay of Plenty 12.30
2 Auckland vs. Northland Sep 19 Auckland 19.90
3 Otago vs. Manawatu Sep 20 Otago 10.40
4 Counties Manukau vs. Waikato Sep 21 Counties Manukau 5.90
5 Wellington vs. Canterbury Sep 21 Canterbury -6.90
6 Taranaki vs. Bay of Plenty Sep 21 Taranaki 4.40
7 Tasman vs. Hawke’s Bay Sep 22 Tasman 8.30
8 Southland vs. North Harbour Sep 22 Southland 0.20


Currie Cup Predictions for Round 7

Team Ratings for Round 7

Here are the team ratings prior to Round 7, along with the ratings at the start of the season. I have created a brief description of the method I use for predicting rugby games. Go to my Department home page to see this.

Here are the team ratings prior to this week’s games, along with the ratings at the start of the season.

Current Rating Rating at Season Start Difference
Western Province 4.17 4.47 -0.30
Lions 2.52 -1.22 3.70
Sharks 2.51 3.24 -0.70
Cheetahs -1.73 -2.74 1.00
Blue Bulls -3.89 0.59 -4.50
Griquas -5.73 -6.48 0.80


Performance So Far

So far there have been 18 matches played, 9 of which were correctly predicted, a success rate of 50%.

Here are the predictions for last week’s games.

Game Date Score Prediction Correct
1 Cheetahs vs. Lions Sep 13 26 – 23 3.30 TRUE
2 Griquas vs. Sharks Sep 14 24 – 25 -0.70 TRUE
3 Blue Bulls vs. Western Province Sep 14 18 – 29 1.70 FALSE


Predictions for Round 7

Here are the predictions for Round 7. The prediction is my estimated expected points difference with a positive margin being a win to the home team, and a negative margin a win to the away team.

Game Date Winner Prediction
1 Western Province vs. Griquas Sep 20 Western Province 17.40
2 Sharks vs. Cheetahs Sep 21 Sharks 11.70
3 Lions vs. Blue Bulls Sep 21 Lions 13.90


NRL Predictions for the Semi-Finals

Team Ratings for Finals Week 2

Here are the team ratings prior to this week’s games, along with the ratings at the start of the season. I have created a brief description of the method I use for predicting rugby games. Go to my Department home page to see this.

Current Rating Rating at Season Start Difference
Roosters 11.32 -5.68 17.00
Storm 9.31 9.73 -0.40
Sea Eagles 7.70 4.78 2.90
Rabbitohs 7.05 5.23 1.80
Cowboys 6.60 7.05 -0.40
Knights 6.36 0.44 5.90
Bulldogs 2.16 7.33 -5.20
Titans 2.11 -1.85 4.00
Sharks 1.89 -1.78 3.70
Warriors -0.89 -10.01 9.10
Panthers -2.57 -6.58 4.00
Broncos -5.15 -1.55 -3.60
Dragons -8.18 -0.33 -7.90
Raiders -10.23 2.03 -12.30
Wests Tigers -11.37 -3.71 -7.70
Eels -19.87 -8.82 -11.00


Performance So Far

So far there have been 196 matches played, 118 of which were correctly predicted, a success rate of 60.2%.

Here are the predictions for last week’s games.

Game Date Score Prediction Correct
1 Rabbitohs vs. Storm Sep 13 20 – 10 0.30 TRUE
2 Sharks vs. Cowboys Sep 14 20 – 18 -0.77 FALSE
3 Roosters vs. Sea Eagles Sep 14 4 – 0 3.52 TRUE
4 Bulldogs vs. Knights Sep 15 6 – 22 4.36 FALSE


Predictions for Finals Week 2

Here are the predictions for Finals Week 2. The prediction is my estimated expected points difference with a positive margin being a win to the home team, and a negative margin a win to the away team.

Game Date Winner Prediction
1 Sea Eagles vs. Sharks Sep 20 Sea Eagles 5.80
2 Storm vs. Knights Sep 21 Storm 7.40


Probably overselling it

The Herald has a story about hazards of coffee. The picture caption says

Men who drink more than four cups a day are 56 per cent more likely to die.

which is obviously not true: deaths, as we’ve observed before, are fixed at one per customer.  The story says

It’s not that people are dying at a rapid rate. But men who drink more than four cups a day are 56 per cent more likely to die and women have double the chance compared with moderate drinkers, according to the The University of Queensland and the University of South Carolina study.

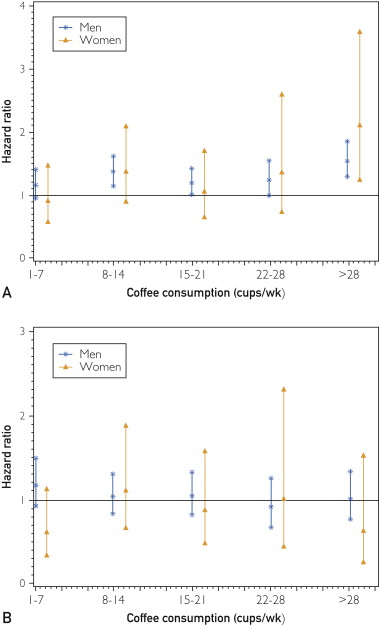
What the study actually reported was rates of death: over an average of 17 years, men who drink more than four cups a day died at about a 21% higher rate, with little evidence of any difference in men.  After they considered only men and women under 55 (which they don’t say was something they had planned to do), and attempted to control for a whole bunch of other factors, the rate increase went to 56% for men, but with a huge amount of uncertainty. Here are their graphs showing the estimate and uncertainty for people under 55 (top panel) and over 55 (bottom panel)

FPO-1


There’s no suggestion of an increase in people over 55, and a lot of uncertainty in people under 55 about how death rates differed by coffee consumption.

In this sort of situation you should ask what else is already known.  This can’t have been the first study to look at death rates for different levels of coffee consumption. Looking at the PubMed research database, one of the first hits is a recent meta-analysis that puts together all the results they could find on this topic.  They report

This meta-analysis provides quantitative evidence that coffee intake is inversely related to all cause and, probably, CVD mortality.

That is, averaging across all 23 studies, death rates were lower in people who drank more coffee, both men and women. It’s just possible that there’s an adverse effect only at very high doses, but the new study isn’t very convincing, because even at lower doses it doesn’t show the decrease in risk that the accumulated data show.

So. The new coffee study has lots of uncertainty. We don’t know how many other ways they tried to chop up the data before they split it at age 55 — because they don’t say. Neither their article nor the press release gave any real information about past research, which turns out to disagree fairly strongly.


September 17, 2013

What you’re not paying for medicines

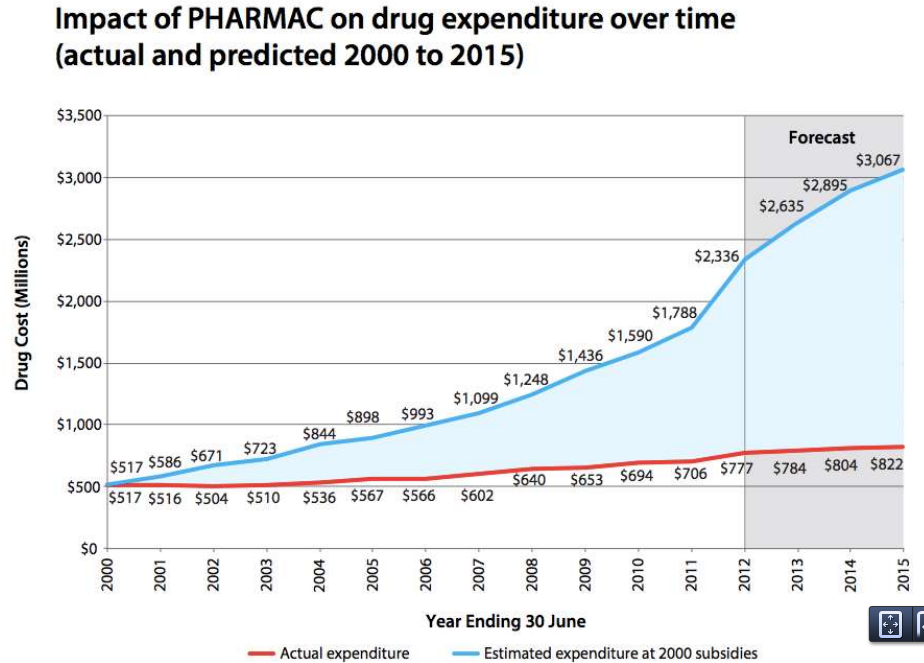
From Pharmac’s annual report for 2012 (via @sudhvir), a graph comparing actual government expenditure on subsidised drugs (red) with what would be projected under pre-Pharmac subsidy policies (blue)

BUVq0j2CEAAlYtj


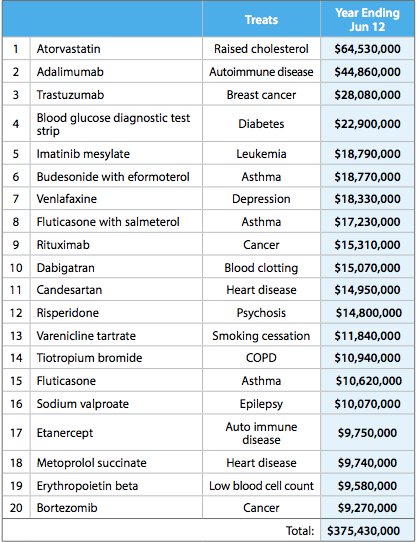
This table from the report shows some of how this was done. It shows the twenty drugs on which the most money was spent

top20


Many of these are new (any drug whose name ends in ‘b’ is likely to be new), but they are mostly drugs that are genuinely better, at least for a subset of patients, than the alternatives.  The top of the list, atorvastatin, lowers cholesterol more effectively than the cheaper simvastatin. It’s the best selling drug of all time, but in New Zealand is used only in a relatively small set of  people whose cholesterol doesn’t go down enough on simvastatin. Adalimumab was a breakthrough in serious rheumatoid arthritis, and trastuzumab is the revolutionary breast cancer treatment sold as Herceptin.

Further down the list, candesartan is a blood pressure drug that can be used in people who have side-effects with some other blood pressure drugs. In Australia, candesartan and its relatives are used very widely; here they are used only when other drugs are insufficient or not tolerated.

Pharmac isn’t perfect, and I think it’s underfunded, but it does a very good job of getting most of the benefit of modern pharmaceutical medicine at a very low price.

Two drunk statisticians leave a bar ….

The below is posted on behalf of Mark Holmes from the Department of Statistics at The University of Auckland. Colleague James Curran read this piece on Wired Science  and challenged him to respond to the following:

Suppose that two drunk statisticians leave a bar (located in the middle of an infinite forest) together.  They stumble around at random and get lost.  Will they ever find each other again?

Mark, helpfully, rose to the bait (thanks, Mark!)  This is what he says:

Assuming 1) that the drunks will live (and stumble around drunk) forever, and that 2) the forest is two dimensional (i.e. there is infinite space to move in both N-S and E-W directions, and the drunks can’t climb infinitely high trees!)  then the answer is yes, they will meet each other again.

Perhaps the best way to explain this is to consider the difference between their locations.  If after n steps the first statistician is at position X_n and the second at position Y_n, then let’s look at D_n=X_n-Y_n.  The two drunks will meet at any time n when X_n=Y_n, which is the same as D_n=(0,0) (the position at time n has two coordinates since we are in two dimensions).

It turns out that D_n itself is essentially a simple random walk, and that the two drunks not only meet again, but they meet infinitely often, because D_n returns to (0,0) infinitely often.  The posh way of saying this is that “simple symmetric random walk in two dimensions is recurrent”.  It is perhaps not surprising that if instead of stumbling around an infinite forest they stumble along an infinite footpath (one dimensional), they will also meet each other infinitely often (“simple symmetric random walk in one dimension is recurrent”).  Note that if the bar is located instead in an infinitely high, wide and long mall they might never meet again (“simple symmetric random walk in three dimensions is not recurrent”).

If the above was good news for the drunks, there is some bad news.  Although they will meet each other again in finite time, the  “average” time it takes them to meet again is infinite.  This is true both in the forest and on the footpath.

If you are interested in the relevant calculations, ask a graduate student in probability (they should also be easy to find on the internet).  If you are satisfied that you understand that, try to solve the following:

 “A physicist, a probabilist and a statistician walk out of a bar…..”

Suppose that we have three independent random walkers instead of two.  The above discussion says that each PAIR of walkers will meet each other infinitely often (in two dimensions).  Will all three meet each other simultaneously?


… so, dear readers, let us have it!  Don’t be shy.


September 16, 2013

Stat of the Week Competition: September 14 – 20 2013

Each week, we would like to invite readers of Stats Chat to submit nominations for our Stat of the Week competition and be in with the chance to win an iTunes voucher.

Here’s how it works:

  • Anyone may add a comment on this post to nominate their Stat of the Week candidate before midday Friday September 20 2013.
  • Statistics can be bad, exemplary or fascinating.
  • The statistic must be in the NZ media during the period of September 14 – 20 2013 inclusive.
  • Quote the statistic, when and where it was published and tell us why it should be our Stat of the Week.

Next Monday at midday we’ll announce the winner of this week’s Stat of the Week competition, and start a new one.

(more…)

September 15, 2013

Sometimes you don’t need to do the maths

On Friday, Stuff had a story about 10 pairs of twins in the same school in Wellington.

At this point I was going to break out the Stats New Zealand website and find out how many pairs of twins of school age there are in the country, and work how many schools you’d expect to have these sorts of numbers.  But when I went back to search for the story I found

  • A Herald story from last September, with 14 sets of twins in a Dunedin school
  • A Stuff story from last October, with 4 sets, in Timaru
  • A Stuff story from April, with 9 sets, in Manurewa
  • A Stuff story from June, with 3 sets in the same class, Palmerston Nth
  • A Stuff story from August, with 5 sets of twins and two of triplets, in Timaru

That’s just the past year, since the stories go on back in the past, and even stretch to other countries: a Stuff story from June was about 24 sets of twins in an Illinois school.

At some point it must be hard to keep pretending this is a surprise.


Briefly

crop-nautilus-rx

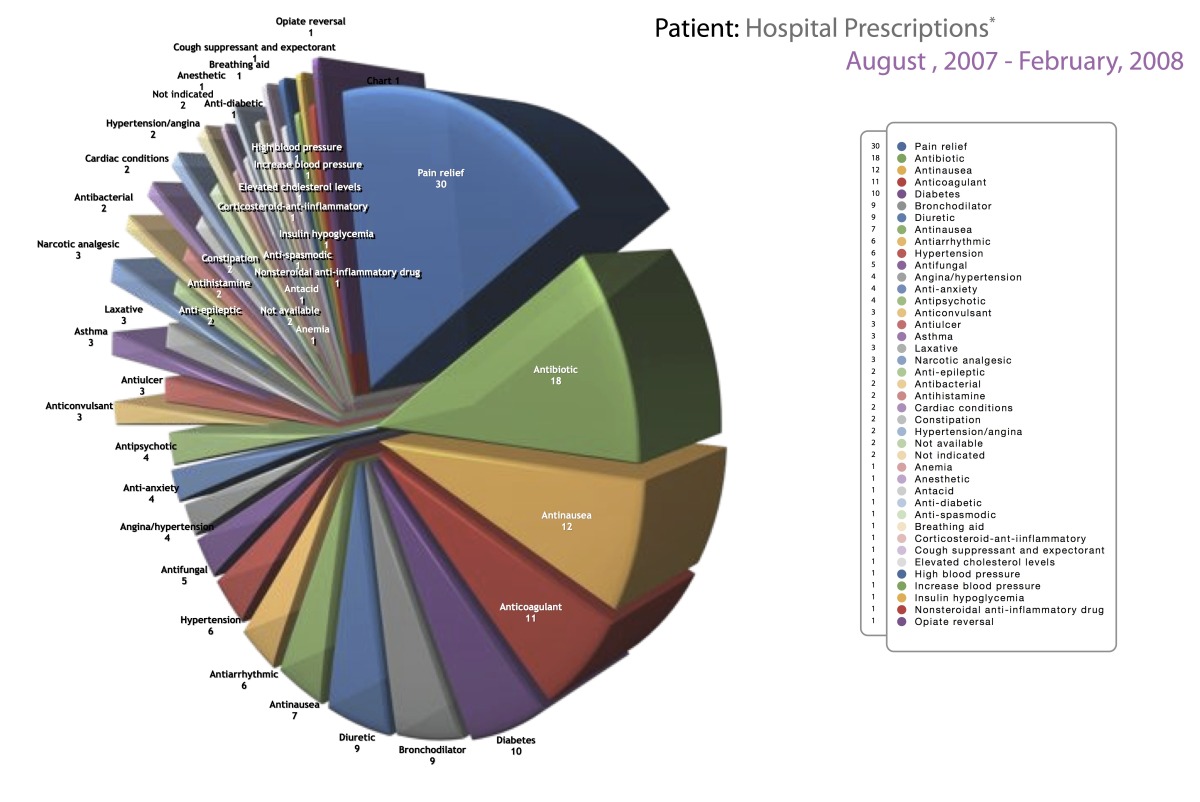
To be fair, the purpose of the chart probably is just to look ugly and complicated, not to convey quantitative information

  • A fascinating statistic: 1/3 of emergency calls (111 number) are due to pocket dialing from mobile phones. Since nearly 50% are real, that means Kiwi butts are responsible for twice as many calls as pranks and cranks.
September 14, 2013

Not how election polls work

The Dominion Post has a story (via @LewSOS) on the Wellington mayoral elections.

John Morrison is leading incumbent Celia Wade-Brown in the race for the Wellington mayoralty, according to a poll of Dominion Post readers.

Mr Morrison, who has been a city councillor for the past 15 years, had support from 27 per cent of the 635 readers surveyed last week – while Ms Wade-Brown trails on 17 per cent.

They don’t say how the survey was done — it’s not clear how you would get a representative sample of Dominion Post readers.  For all we can tell, it might just be a bogus poll.  It’s also not clear, on this topic, why Dominion Post readers are even the population you would want, since the story continues

Of those surveyed, 275 were eligible to vote in the Wellington City Council elections.

You’d at least expect that the voting preferences would be broken out by eligibility.

Sadly, no.