May 10, 2013

The Art of Data Visualisation

The information content in this video (7m38s) from PBS’ Off Book series is on the low side but its still an interesting watch, if only for a large collection of graphic designers’ appealing but appalling infographics.

Briefly

  • Forbes has a profile of a soon-to-be billionaire statistician, Dennis Gillings.  He basically invented the commercial clinical research model, and his company, Quintiles, is going public. 
  • The New York Times has a story about data(!) and science(!) being used to modify Hollywood scripts.  As Matt Yglesias points out, the studios can’t really take it that seriously or they’d be paying more than $20 000 for the service
  • Some Big Data backlash, from Quartz. Most data isn’t big, most data isn’t very good quality, and most businesses are in more need of expertise on data analysis than on large-scale computing.
May 9, 2013

Is Georgie Pie’s pricing too high?

The news media is covering an apparent public backlash over the price of reintroduced Georgie Pie pies.

Is $4.50 for a steak and cheese pie too expensive?

It wasn’t easy to track down past prices for Georgie Pie pies, but thanks to an old ad on YouTube, I found out that in 1993, small Georgie Pie steak and cheese pies cost $1 and large ones $2.

It’s not clear what size the new pies will be. However, if we use the
Consumer Price Index to get an idea of what those 1993 prices would be today, we get $1.60 for a small pie and $3.20 for a large.

Counting signatures

A comment on the previous post about the asset-sales petition asked how the counting was done: the press release says

Upon receiving the petition the Office of the Clerk undertook a counting and sampling process. Once the signatures had been counted, a sample of signatures was taken using a methodology provided by the Government Statistician.

It’s a good question and I’d already thought of writing about it, so the commenter is getting a temporary reprieve from banishment for not providing a full name.  I don’t know for certain, and the details don’t seem to have been published, which is a pity — they would be interesting and educationally useful, and there doesn’t seem to be any need for confidentiality.

While I can’t be certain, I think it’s very likely that the Government Statistician provided the estimation methodology from Statistics New Zealand Working Paper No 10-04, which reviews and extends earlier research on petition counting.

There are several issues that need to be considered

  • removing signatures that don’t come with the required information
  • estimating the number of eligible vs ineligible signatures
  • estimating the number of duplicates
  • estimating the margin of error in the estimate
  • deciding what level of uncertainty is acceptable

The signatures without the required information are removed completely; that’s not based on sampling.  Estimating eligible vs ineligible signatures is fairly easy by checking a sufficiently-large random sample — in fact, they use a systematic sample, taking names at regular intervals through the petition list, which tends to give more precise results and to be more auditable.  

Estimating unique signatures is  tricky, because if you halve your sample size, you expect to see 1/4 as many duplicates, 1/8 as many triplicates, and so on. The key part of the working paper shows how to scale up the the sample data on eligible, ineligible, and duplicate, triplicate, etc, signatures to get the unique unbiased estimator of the number of valid signatures and its variance.

Once the level of uncertainty is specified, the formulas tell you what sample size to verify and what to do with the results.  I don’t know how the sample size is chosen, but it wouldn’t take a very large sample to get the uncertainty down to a few thousand, which would be good enough.   In fact, since the methodology is public and the parties have access to the electoral roll in electronic form, it’s a bit surprising that the petition organisers didn’t run a quick check themselves before submitting it.


May 8, 2013

NRL Predictions, Round 9

Team Ratings for Round 9

Here are the team ratings prior to Round 9, along with the ratings at the start of the season. I have created a brief description of the method I use for predicting rugby games. Go to my Department home page to see this.

Current Rating Rating at Season Start Difference
Rabbitohs 8.15 5.23 2.90
Storm 7.65 9.73 -2.10
Sea Eagles 7.30 4.78 2.50
Roosters 5.21 -5.68 10.90
Bulldogs 4.03 7.33 -3.30
Cowboys 3.49 7.05 -3.60
Knights 3.12 0.44 2.70
Broncos 1.31 -1.55 2.90
Raiders -2.48 2.03 -4.50
Sharks -2.76 -1.78 -1.00
Dragons -2.83 -0.33 -2.50
Titans -3.09 -1.85 -1.20
Panthers -5.83 -6.58 0.70
Wests Tigers -8.10 -3.71 -4.40
Warriors -8.12 -10.01 1.90
Eels -10.80 -8.82 -2.00


Performance So Far

So far there have been 64 matches played, 41 of which were correctly predicted, a success rate of 64.06%.

Here are the predictions for last week’s games.

Game Date Score Prediction Correct
1 Broncos vs. Rabbitohs May 03 12 – 26 0.58 FALSE
2 Bulldogs vs. Wests Tigers May 03 40 – 4 11.79 TRUE
3 Storm vs. Raiders May 04 20 – 24 19.28 FALSE
4 Eels vs. Cowboys May 04 10 – 14 -11.24 TRUE
5 Warriors vs. Titans May 05 25 – 24 -0.91 FALSE
6 Knights vs. Sharks May 05 20 – 21 13.23 FALSE
7 Roosters vs. Panthers May 05 30 – 6 13.43 TRUE
8 Dragons vs. Sea Eagles May 06 18 – 24 -5.53 TRUE


Predictions for Round 9

Here are the predictions for Round 9. The prediction is my estimated expected points difference with a positive margin being a win to the home team, and a negative margin a win to the away team.

Game Date Winner Prediction
1 Rabbitohs vs. Cowboys May 10 Rabbitohs 9.20
2 Wests Tigers vs. Sharks May 10 Sharks -0.80
3 Warriors vs. Bulldogs May 11 Bulldogs -7.70
4 Eels vs. Broncos May 11 Broncos -7.60
5 Raiders vs. Knights May 12 Knights -1.10
6 Titans vs. Dragons May 12 Titans 4.20
7 Panthers vs. Storm May 12 Storm -9.00
8 Sea Eagles vs. Roosters May 13 Sea Eagles 6.60


Super 15 Predictions, Round 13

Team Ratings for Round 13

This year the predictions have been slightly changed with the help of a student, Joshua Dale. The home ground advantage now is different when both teams are from the same country to when the teams are from different countries. The basic method is described on my Department home page.

Here are the team ratings prior to Round 13, along with the ratings at the start of the season.

Current Rating Rating at Season Start Difference
Crusaders 6.67 9.03 -2.40
Bulls 5.83 2.55 3.30
Chiefs 5.02 6.98 -2.00
Stormers 3.98 3.34 0.60
Brumbies 3.64 -1.06 4.70
Sharks 3.16 4.57 -1.40
Blues 2.08 -3.02 5.10
Waratahs -0.11 -4.10 4.00
Reds -0.27 0.46 -0.70
Cheetahs -1.12 -4.16 3.00
Hurricanes -2.39 4.40 -6.80
Highlanders -5.41 -3.41 -2.00
Force -9.35 -9.73 0.40
Rebels -11.03 -10.64 -0.40
Kings -15.51 -10.00 -5.50


Performance So Far

So far there have been 75 matches played, 51 of which were correctly predicted, a success rate of 68%.

Here are the predictions for last week’s games.

Game Date Score Prediction Correct
1 Blues vs. Stormers May 03 18 – 17 2.30 TRUE
2 Rebels vs. Chiefs May 03 33 – 39 -13.20 TRUE
3 Highlanders vs. Sharks May 04 25 – 22 -6.00 FALSE
4 Force vs. Reds May 04 11 – 11 -7.80 FALSE
5 Kings vs. Waratahs May 04 10 – 72 -1.80 TRUE
6 Bulls vs. Hurricanes May 04 48 – 14 8.10 TRUE
7 Brumbies vs. Crusaders May 05 23 – 30 2.50 FALSE


Predictions for Round 13

Here are the predictions for Round 13. The prediction is my estimated expected points difference with a positive margin being a win to the home team, and a negative margin a win to the away team.

Game Date Winner Prediction
1 Chiefs vs. Force May 10 Chiefs 18.40
2 Reds vs. Sharks May 10 Reds 0.60
3 Cheetahs vs. Hurricanes May 10 Cheetahs 5.30
4 Blues vs. Rebels May 11 Blues 17.10
5 Waratahs vs. Stormers May 11 Stormers -0.10
6 Kings vs. Highlanders May 11 Highlanders -6.10


Does emergency hospital choice matter?

The Herald has a completely over-the-top presentation of what might be an important issue. The headline is “Hospital choice key to kids’ survival”, and the story starts off

Where ambulances take badly injured children first seems to affect their chances, paediatric surgeons say.

Starship children’s hospital surgeons have found that sending badly injured children to the wrong hospital may be contributing to a child death rate from injuries that is twice the rate of Australia’s.

The data:

Six (7 per cent) of the 88 children who went first to Middlemore died, but so did one (8 per cent) of the 12 who went directly to Starship.

That is, to the extent the data tell us anything, the evidence is against the headline.  Of course, the uncertainties are huge: a 95% confidence interval for the relative odds of dying after being sent to Middlemore goes from a 40-fold decrease to a 12-fold increase.  There’s basically no information in the survival data.

So, how much of the two-fold higher rate of death in NZ compared to Australia could reasonably be explained by suboptimal hospital choice? One of the surgeons involved in the study says

… overseas research showed that a good trauma protocol system could cut the death rate for injured adults by 20 to 30 per cent, but there was no good data for children.

That is, hardly any of the difference between NZ and Australia — especially as this specific hospital-choice issue only applies to one sector of one city in New Zealand, with less than 10% of the national population.

On the other hand, we see

The head of Starship’s emergency department, Dr Mike Shepherd, said the major factors contributing to New Zealand’s high fatal injury rate for children lay outside the hospital system in policies such as driver blood-alcohol limits, graduated driver licensing, and laws requiring children’s booster seats and swimming pool fences.

That sounds plausible, but if it’s the whole story you would expect high levels of non-fatal as well as fatal injuries. The overall rate of hospitalisations for injuries in children 0-14 years is almost identical in NZ (1395 per 100 000 per year, p29) and Australia (‘about’ 1500 per 100 000 per year, page v).


May 7, 2013

Not adding up

As you know, the petition for a referendum over asset sales has not reached its goal yet, due to lots of invalid signatures. This is not a new problem — the petition over the anti-smacking law initially had 17% invalid signatures and also fell short of its threshold on the first round — but it does seem to be worse than usual.

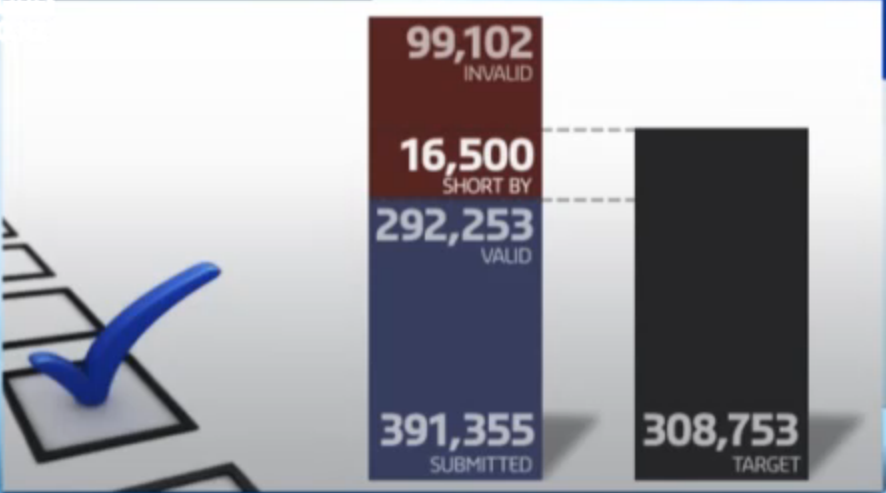
3News displayed this graph of the shortfall

petition shortfall


It seemed to me that the 16,500 bar was a bit wider that I’d expect, so I checked on the video from the website.  On my screen capture, which I think is what you get if you click on the image, the black bar has 872 signatures per pixel, the blue bar has 1018 signatures per pixel, the whole red bar has 535 signatures per pixel, and the 16500 shortfall has 232 signatures per pixel.  That is, the vertical scale for the shortfall is about four times that for the valid signatures.

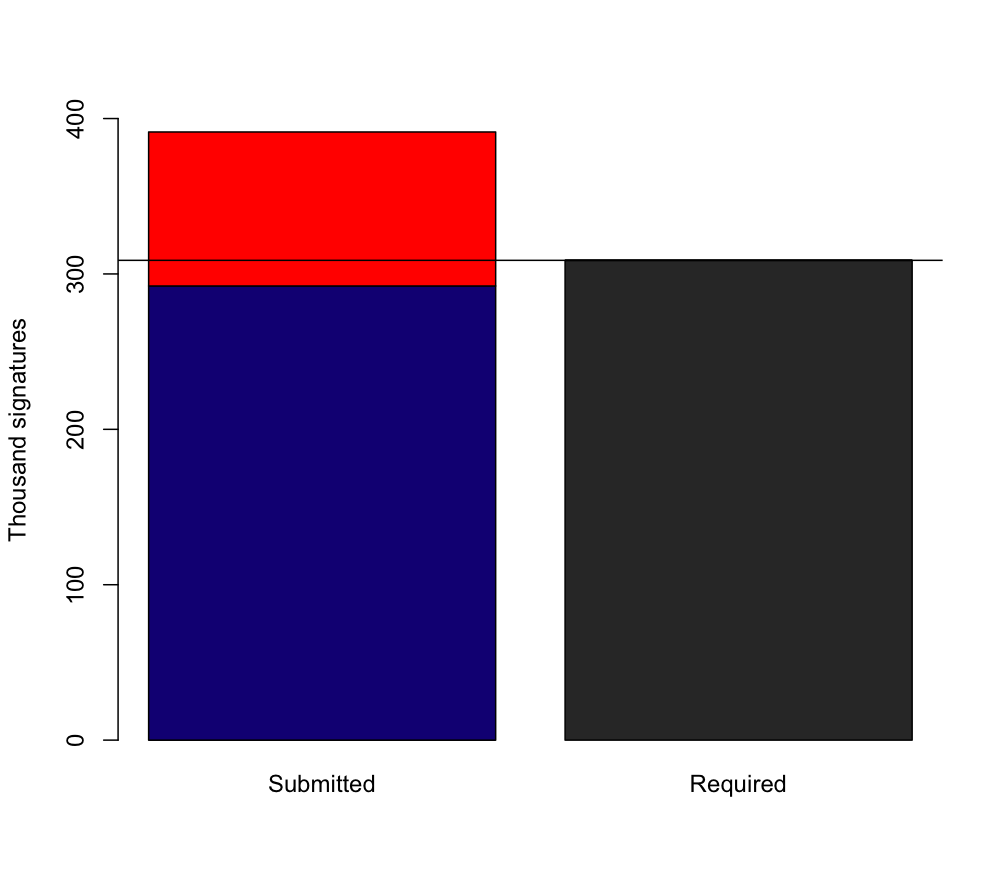
I’m really not accusing 3News of deliberately distorting the numbers — it looks to me as if the shortfall bar has been made the right height to contain its text, that the blue+red bars height is scaled to the available screen estate, and that the black bar is scaled to the total blue+red height .  But it’s a pity that the result is to amplify the visual size of the shortfall — and if the visual size weren’t important the graph would be a complete waste of time.

Scaled in proportion, the bars look like this

shortfall


Video on randomised trials — in poverty relief

The organisation Innovations for Poverty Action have made a neat little animated video explaining how and why they do randomised controlled trials of poverty-relief programs.


Modestly significant

From a comment piece in Stuff, by Bruce Robertson (of Hospitality NZ)

In the past five years, the level of hazardous drinking has significantly decreased for men (from 30 per cent to 26 per cent) and marginally decreased for women (13 per cent to 12 per cent).

There was a modest but important drop in the rates of hazardous drinking among Maori adults, with the rate falling from 33 per cent to 29 per cent in the latest survey.

As @tui_talk pointed out on Twitter, that’s a four percentage point decrease described as “significant” for men and “modest” for Maori.

At first I thought this might be a confusion of “statistically significant” with “significant”, with the decrease in men being statistically significant but the difference in Maori not, but in fact the MoH report being referenced says (p4)

As a percentage of all Māori adults, hazardous drinking patterns significantly decreased from 2006/07 (33%) to 2011/12 (29%).