May 6, 2013

A good graph

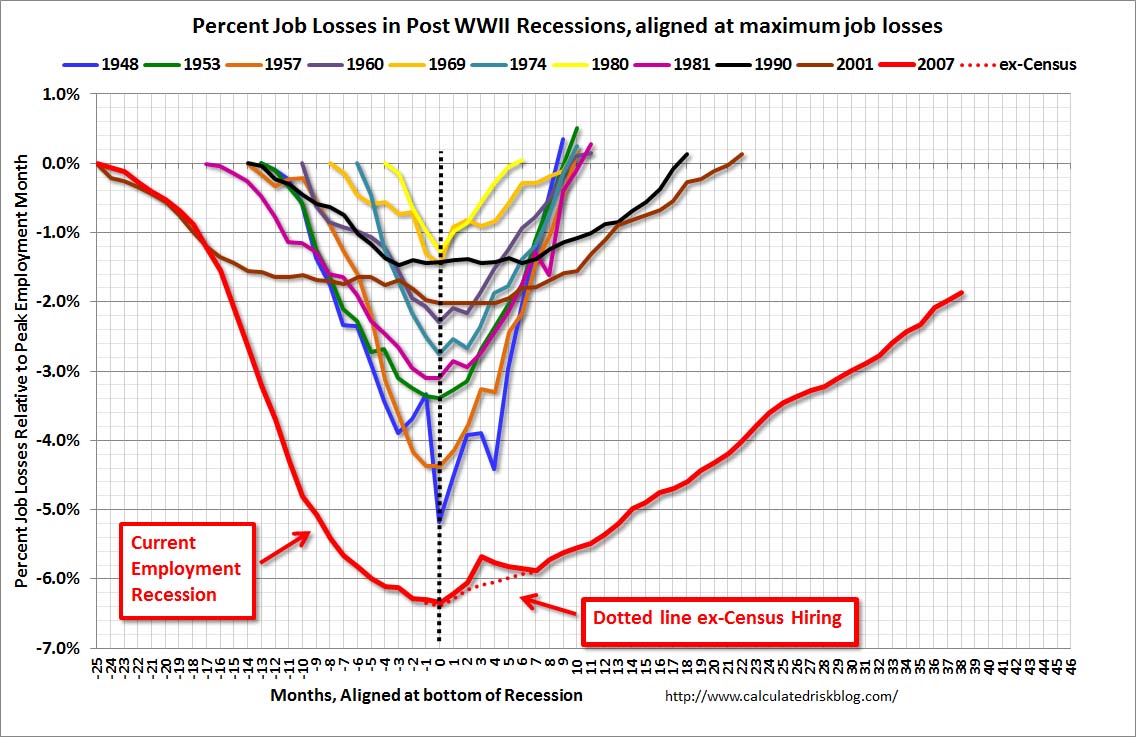
StatsChat spends a lot of time criticizing bad graphs.  Here’s a simple but good graph, from the Calculated Risk blog

EmployRecAlignedApr2013


The graph shows employment during US recessions, aligned at the point of maximum job loss.  It clearly demonstrates that the current Great Recession is very different from all the other post-WWII recessions, both in depth and in duration.

It would be easy to quibble with some design choices in the graph, but it fulfills the basic requirements admirably: the real difference is visually dramatic, and it wouldn’t be visually dramatic if it weren’t real.

Chocolate bait and switch

Headline:  Study: Dark chocolate calms you down

Lead:

Eating dark chocolate can calm you down according to a new study.

Number of people actually given dark chocolate in the study: 0  (more…)

Developing data visualisations: draft and redraft

As I’ve commented before, it’s hard to find examples of the drafting and redrafting process for graphics, which is  just as necessary as it is for text.

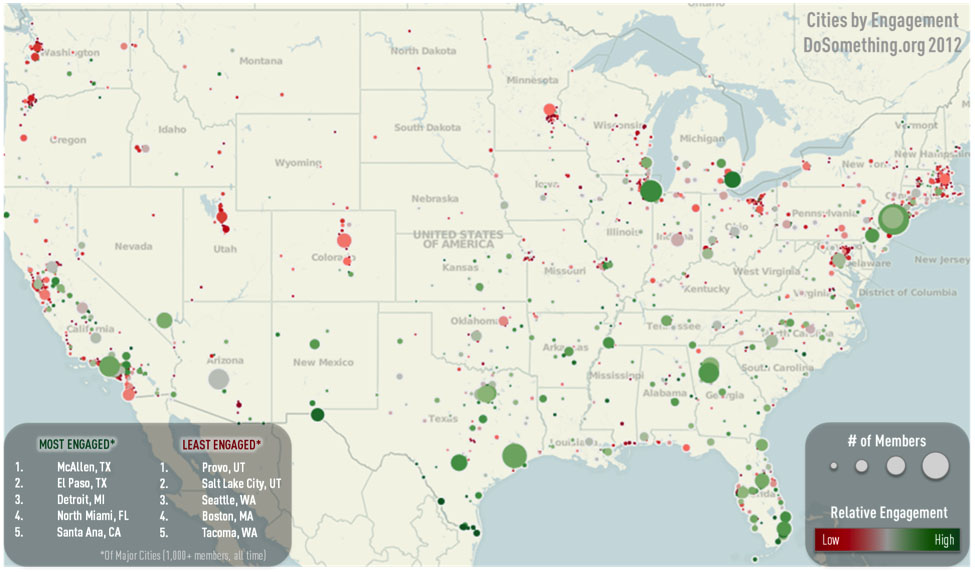
A post at Harvard Business Review describes the process, in the setting of a large non-profit organisation, with this as the result

bladt1

Some surprising things

  • From Felix Salmon: US population is increasing, and people are moving to the cities, so why is (sufficiently fine-scale) population density going down? Because rich people take up more space and fight for stricter zoning.  You’ve heard of NIMBYs, but perhaps not of BANANAs
  • From the New York Times.  One of the big credit-rating companies is no longer using debts referred for collection as an indicator, as long as they end up paid.  This isn’t a new spark of moral feeling, it’s just for better prediction.
  • And from Felix Salmon again: Firstly, Americans are bad at statistics. When it comes to breast cancer, they massively overestimate the probability that early diagnosis and treatment will lead to a cure, while they also massively underestimate the probability that an undetected cancer will turn out to be harmless.

Frontiers in pie-charts

The `pie’ in pie-chart is a metaphor — the charts are divided into slices in the way that certain kinds of pie are, and the slices add up to the whole pie.

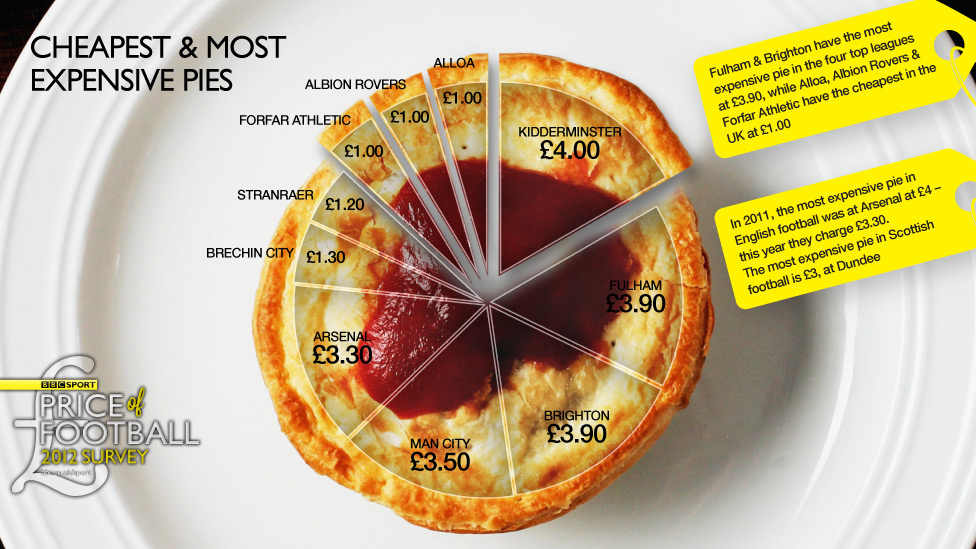
Or, at least, that’s usually the idea.  One of StatChats’s foreign correspondents sent in this effort from the BBC

piefail


This kind of pie doesn’t get divided into slices — it would just fall apart.  And in this graph the slices don’t add up to anything meaningful — for those of you not up on the British sports scene: there are actually more than ten football clubs.  In the graphic we have Premier League teams such as Arsenal and Manchester City mixed in with  Albion Rovers and Brechin City from the Scottish 2nd division.

The pie price pie exemplifies a general rule, if you have to write all the data values on your graph, the graph isn’t doing its share of the work.

Stat of the Week Competition: May 4 – 10 2013

Each week, we would like to invite readers of Stats Chat to submit nominations for our Stat of the Week competition and be in with the chance to win an iTunes voucher.

Here’s how it works:

  • Anyone may add a comment on this post to nominate their Stat of the Week candidate before midday Friday May 10 2013.
  • Statistics can be bad, exemplary or fascinating.
  • The statistic must be in the NZ media during the period of May 4 – 10 2013 inclusive.
  • Quote the statistic, when and where it was published and tell us why it should be our Stat of the Week.

Next Monday at midday we’ll announce the winner of this week’s Stat of the Week competition, and start a new one.

(more…)

May 3, 2013

Screening

Stuff has a story  (borrowed from the West Island) headlined “Over 40? Five tests you need right now”.

You might have expected some reference to the other recent news about screening: that the US Preventive Services Taskforce has now joined the Centers for Disease Control in recommending universal screening for HIV (as TVNZ reported).  It’s not clear if New Zealand will follow the trend — HIV infection in people not in high risk groups is less common here than in the US, so the benefit compared to more selective screening is smaller here.   This illustrates the complexities of population screening.  Not only does the test have to be accurate, especially in terms of its false positive rate, but there needs to be something useful you can do about a positive result, and screening everyone has to be better than just screening selected people.

So, let’s  compare the suggestions from Stuff’s story to what national and international expert guidelines say you need.

Two of the tests, for high blood pressure and high cholesterol, are spot on. These are part of the national 2012/13 Health Targets for DHBs, with the goal being 75% of the eligible population having the tests within a five-year period.  The Health Target also includes blood glucose measurement to diagnose diabetes, which the story doesn’t mention.  The US Preventive Services Taskforce also recommends blood pressure and cholesterol tests, though it recommends universal diabetes screening only after age 50 or in people with high blood pressure or people with risk factors for diabetes.

One of the tests recommended in the story is a depression/anxiety questionnaire, for diagnosing suicide risk.  Just a couple of weeks ago, the US Preventive Services Taskforce issued guidelines on universal screening for suicide prevention by GPs, saying that there wasn’t good enough evidence to recommend either for or against. As the coverage from Reuters explains, these questionnaires do probably identify people at higher risk of suicide, but it wasn’t clear how much benefit came from identifying them. So, that’s not an unreasonable test to recommend, but it would have been better to indicate that it was controversial.

One more of the tests isn’t a screening test at all — the story recommends that you make sure you know what a standard drink of alcohol is.

The top recommendation in the story, though, is coronary calcium screening.  The US Preventive Services Taskforce recommends against coronary calcium screening for people at low risk of heart disease and says there isn’t enough evidence to recommending for or against in people at higher risk for other reasons. The  American Heart Association also recommends against routine coronary calcium screening (they say it might be useful as a tiebreaker in people known to be at intermediate risk of heart disease based on other factors).  No-one doubts that calcium in the walls of your coronary arteries is predictive of heart disease, but people with high levels of coronary calcium tend to also be overweight or smokers, or have high blood pressure or high cholesterol or diabetes — and if they don’t have these other risk factors  it’s not clear that anything can be done to help them.

As an afterthought on the coronary calcium screening point, the story has an additional quote from a doctor recommending coronary angiography before starting a serious exercise program.  I’d never heard of coronary angiography as a general screening recommendation — it’s a bit more invasive and higher-risk than most population screening. It turns out that the American College of Cardiology and the American Heart Association are similarly unenthusiastic, with their guidelines on use specifically recommending against angiography for screening of people without symptoms of coronary artery disease.


May 2, 2013

Why does no-one listen to us?

Dan Kahan, a researcher in the Cultural Cognition project at Yale Law School, has an interesting post on “the science communication problem”

The motivation behind this research has been to understand the science communication problem. The “science communication problem” (as I use this phrase) refers to the failure of valid, compelling, widely available science to quiet public controversy over risk and other policy relevant facts to which it directly speaks. The climate change debate is a conspicuous example, but there are many others

May 1, 2013

NRL Predictions, Round 8

Team Ratings for Round 8

Here are the team ratings prior to Round 8, along with the ratings at the start of the season. I have created a brief description of the method I use for predicting rugby games. Go to my Department home page to see this.

Current Rating Rating at Season Start Difference
Storm 9.98 9.73 0.30
Sea Eagles 7.25 4.78 2.50
Rabbitohs 6.69 5.23 1.50
Knights 4.55 0.44 4.10
Cowboys 4.21 7.05 -2.80
Roosters 4.16 -5.68 9.80
Broncos 2.76 -1.55 4.30
Bulldogs 1.61 7.33 -5.70
Dragons -2.78 -0.33 -2.50
Titans -2.90 -1.85 -1.00
Sharks -4.18 -1.78 -2.40
Panthers -4.77 -6.58 1.80
Raiders -4.81 2.03 -6.80
Wests Tigers -5.67 -3.71 -2.00
Warriors -8.31 -10.01 1.70
Eels -11.53 -8.82 -2.70


Performance So Far

So far there have been 56 matches played, 37 of which were correctly predicted, a success rate of 66.07%.

Here are the predictions for last week’s games.

Game Date Score Prediction Correct
1 Roosters vs. Dragons Apr 25 34 – 10 8.30 TRUE
2 Storm vs. Warriors Apr 25 28 – 18 25.99 TRUE
3 Sea Eagles vs. Rabbitohs Apr 26 12 – 20 8.33 FALSE
4 Cowboys vs. Raiders Apr 27 30 – 12 12.40 TRUE
5 Wests Tigers vs. Broncos Apr 27 10 – 20 -2.42 TRUE
6 Titans vs. Knights Apr 28 6 – 30 2.32 FALSE
7 Sharks vs. Bulldogs Apr 28 8 – 24 2.38 FALSE
8 Panthers vs. Eels Apr 29 42 – 12 6.57 TRUE


Predictions for Round 8

Here are the predictions for Round 8. The prediction is my estimated expected points difference with a positive margin being a win to the home team, and a negative margin a win to the away team.

Game Date Winner Prediction
1 Broncos vs. Rabbitohs May 03 Broncos 0.60
2 Bulldogs vs. Wests Tigers May 03 Bulldogs 11.80
3 Storm vs. Raiders May 04 Storm 19.30
4 Eels vs. Cowboys May 04 Cowboys -11.20
5 Warriors vs. Titans May 05 Titans -0.90
6 Knights vs. Sharks May 05 Knights 13.20
7 Roosters vs. Panthers May 05 Roosters 13.40
8 Dragons vs. Sea Eagles May 06 Sea Eagles -5.50


Super 15 Predictions, Round 12

Team Ratings for Round 12

This year the predictions have been slightly changed with the help of a student, Joshua Dale. The home ground advantage now is different when both teams are from the same country to when the teams are from different countries. The basic method is described on my Department home page.

Here are the team ratings prior to Round 12, along with the ratings at the start of the season.

Current Rating Rating at Season Start Difference
Crusaders 5.91 9.03 -3.10
Chiefs 5.59 6.98 -1.40
Brumbies 4.40 -1.06 5.50
Sharks 3.88 4.57 -0.70
Stormers 3.87 3.34 0.50
Bulls 3.76 2.55 1.20
Blues 2.19 -3.02 5.20
Reds 0.36 0.46 -0.10
Hurricanes -0.31 4.40 -4.70
Cheetahs -1.12 -4.16 3.00
Waratahs -4.93 -4.10 -0.80
Highlanders -6.13 -3.41 -2.70
Force -9.97 -9.73 -0.20
Kings -10.69 -10.00 -0.70
Rebels -11.60 -10.64 -1.00


Performance So Far

So far there have been 68 matches played, 47 of which were correctly predicted, a success rate of 69.1%.

Here are the predictions for last week’s games.

Game Date Score Prediction Correct
1 Hurricanes vs. Stormers Apr 26 16 – 18 0.20 FALSE
2 Reds vs. Blues Apr 26 12 – 11 2.40 TRUE
3 Chiefs vs. Sharks Apr 27 37 – 29 5.30 TRUE
4 Brumbies vs. Force Apr 27 41 – 7 13.60 TRUE
5 Bulls vs. Waratahs Apr 27 30 – 19 13.00 TRUE
6 Cheetahs vs. Kings Apr 27 26 – 12 11.70 TRUE
7 Crusaders vs. Rebels Apr 28 30 – 26 24.80 TRUE


Predictions for Round 12

Here are the predictions for Round 12. The prediction is my estimated expected points difference with a positive margin being a win to the home team, and a negative margin a win to the away team.

Game Date Winner Prediction
1 Blues vs. Stormers May 03 Blues 2.30
2 Rebels vs. Chiefs May 03 Chiefs -13.20
3 Highlanders vs. Sharks May 04 Sharks -6.00
4 Force vs. Reds May 04 Reds -7.80
5 Kings vs. Waratahs May 04 Waratahs -1.80
6 Bulls vs. Hurricanes May 04 Bulls 8.10
7 Brumbies vs. Crusaders May 05 Brumbies 2.50