March 23, 2013

It’s dry

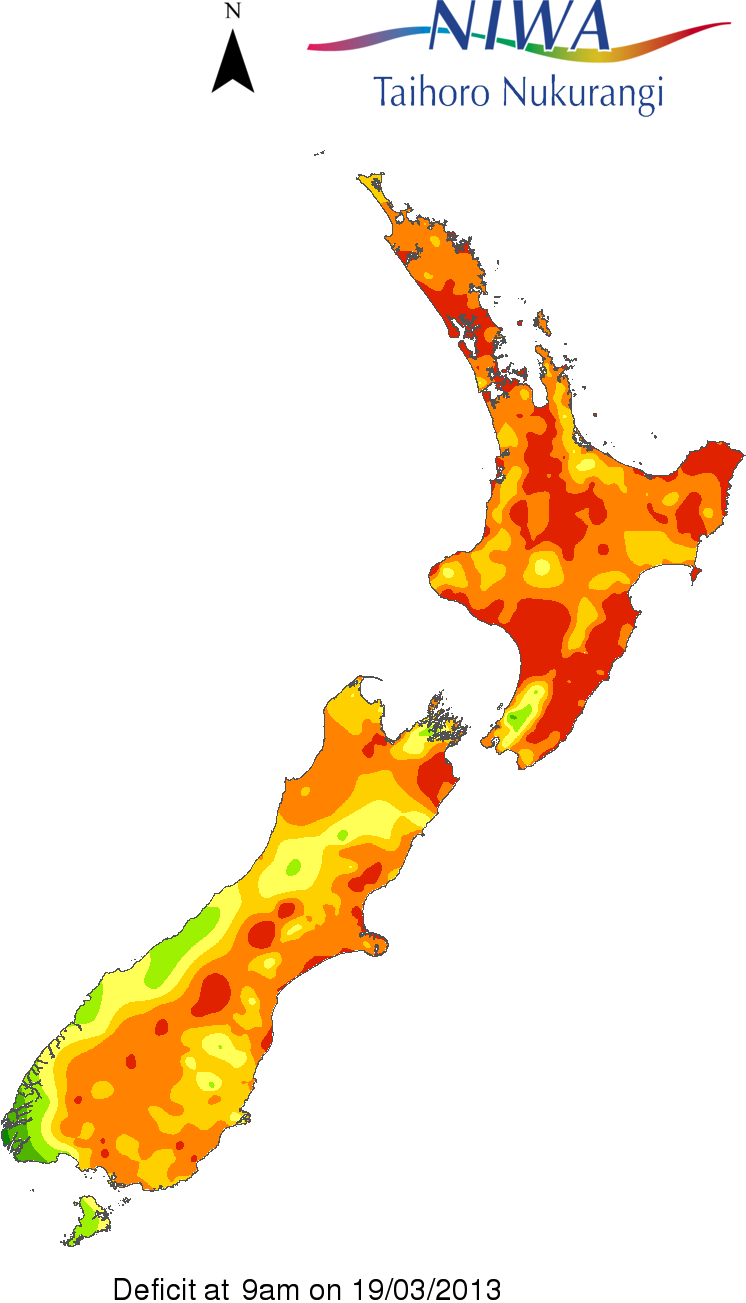
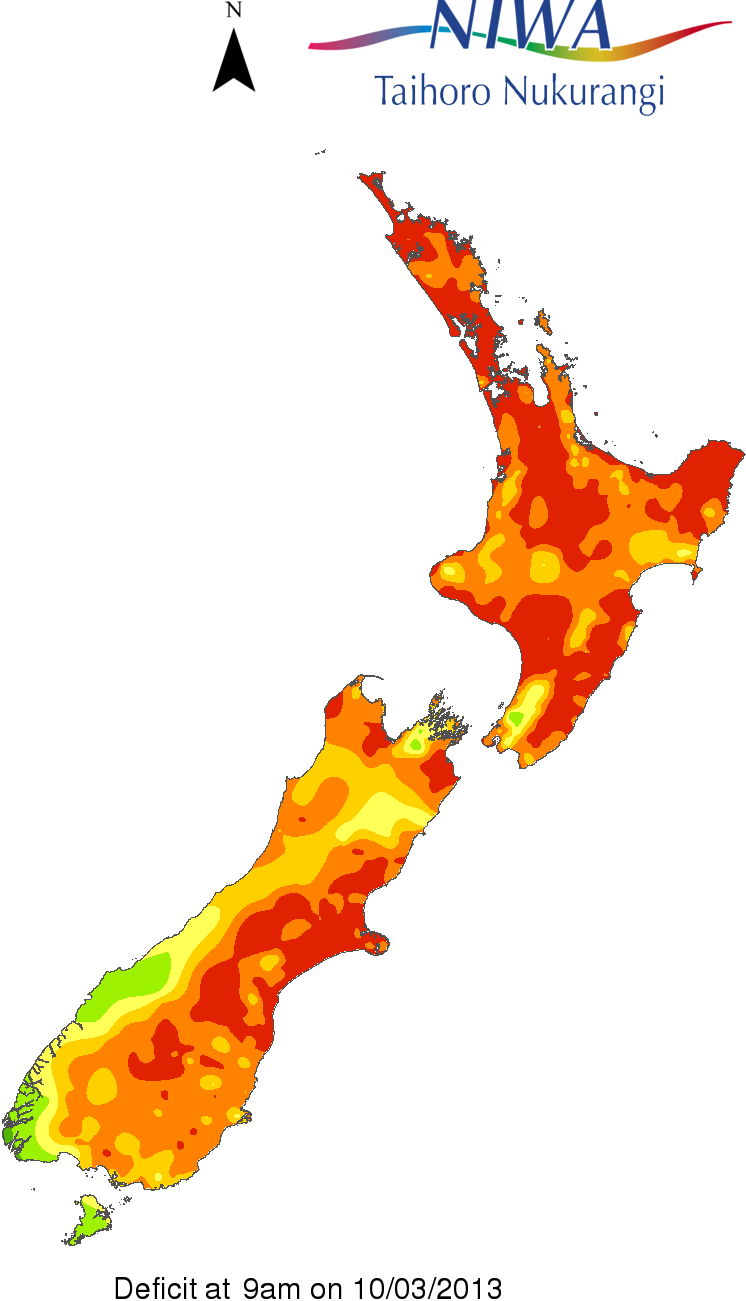
How dry is a 100m soil moisture deficit, which we have over a lot of the country (yellow, on the NIWA soil moisture maps)?

  • 100mm over 1 hectare is 1 million litres
  • A typical full section in Auckland is about 0.07 hectares [ok, I can’t do simple arithmetic, and the US has made me think in acres]
  • Water at the tap costs $1.343/ 1000 litres

So, a 100mm moisture deficit over the area of a city section would need about $1000 of tap water to make up.


When you have two numbers

Last month, Statistics New Zealand released the travel and migration statistics for January.  Visits from China and Hong Kong were notably lower than the past year. This was attributed to Chinese New Year being in February. The media duly reported all this.

Now, Statistics New Zealand has released the travel and migration statistics for January.  Visits from China and Hong Kong were notably higher than the past year. This was attributed to Chinese New Year being in February. The media duly reported all this.

It seems obvious that you’d want to combine the two months, so that the Chinese New Year effect drops out. I haven’t seen anyone do this yet:

  • Visitors from China: Jan+Feb 2012: 23300+15300=38600
  • Vistors from China: Jan+Feb 2013 18800+31500=50300

For Hong Kong the January figures aren’t in the press release, but the change is: there were 2200 more than last year in February, and 1500 fewer in January, for an increase of 700.

So, a fairly big increase in visitors from these countries over the past two years.

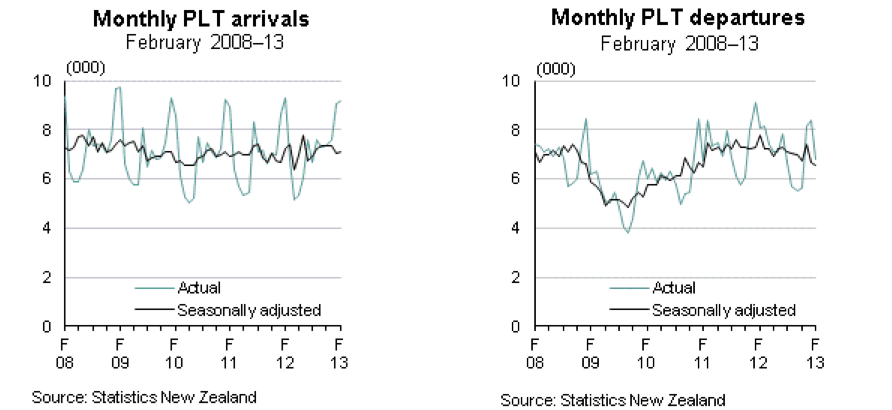
Net migration was also up a bit, and here I think a longer time series than the media reported would be useful.  The full time series in the Stats NZ release looks like

migration


Arrivals are pretty constant.  Departures are slowly declining, but are still much higher than in the 09/10 minimum.

March 22, 2013

Briefly

  • A post at Scientific American about covering clinical trials, for journalists and readers.  It’s a summary from the Association of Health Care Journalists annual conference. Starts out “My message: Ask the hard questions.”
  • Asking the hard questions is also useful in covering surveys.  Stuff reports “Kiwi leaders amongst the world’s riskiest”,
  • New Zealand leaders are among the most likely in the world to ignore data and fail to seek a range of opinions when making decisions

    with no provenance except that this was based on a 600,000 person survey of managers and professionals by SHL.  Before trying to track down any more detail, just think: how could this have worked? How would you get reliable information to support those conclusions from each of 600,000 people? 

  • You may have heard about the famous Hawthorne experiment, where raising light levels in a factory improved output, as did lowering them, as did anything else experimental. The original data have been found and this turns out not to be the case.
March 21, 2013

That’s not worth a thousand words

The Herald has an interesting set of displays of the latest DigiPoll political opinion survey.  According to the internets it was even worse earlier in the day, but we can pass over that and only point out that corrections in news stories shouldn’t happen silently (except perhaps for typos).

We can start with the standard complaint: the margin of error for the poll itself is 3.6%, so the margin of error for change since the last poll is 1.4 times higher, or a little over 5%. None of the changes is larger than 5%, and only one comes close.

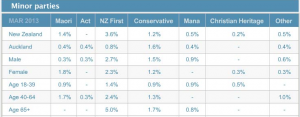
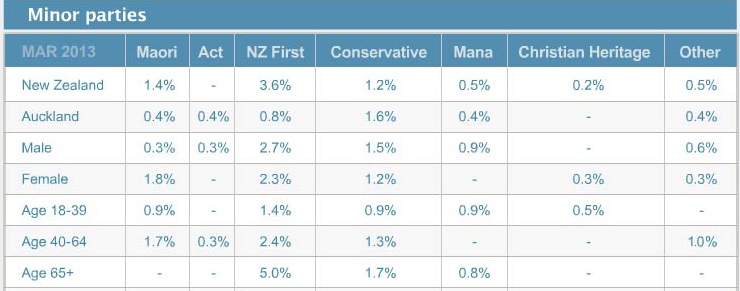
Secondly, there is a big table for the minor parties. I would normally not quote the whole table, but in this case it’s already changed once today.
minorparties


The total reported for the minor parties is 6.1%, and since there were 750 people sampled, 46 of them indicated support for one of these parties. That’s not really enough to split up over 7 parties. These 46 then get split up further, by age and gender. At this point, some of the sample proportions are zero, displayed as “-” for some reason.

[Updated to add: and why does the one male 40-64 yr old Aucklander who supported ACT not show up in the New Zealand total?]

Approximately 1 in 7 New Zealanders is 65+, so that should be about 6 or 7 minor-party supporters in the sample.  That’s really not enough to estimate a split over 7 parties. Actually, the poll appears to have been lucky in recruiting older folks: it looks like 6 NZ First, 2 Conservative, 1 Mana.

That’s all pretty standard overtabulating, but the interesting and creative problems happen at the bottom of the page.  There’s an interactive graph, done with the Tableau data exploration software.  From what I’ve heard, Tableau is really popular in business statistics: it gives a nice clear interface to selecting groups of cells for comparison, dropping dimensions, and other worthwhile data exploration activities, and helps analysts present this sort of thing to non-technical managers.

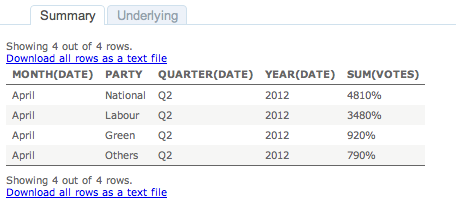
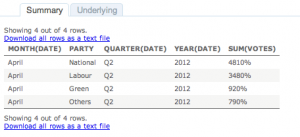
However, the setup that the Herald have used appears to be intended for counts or totals, not for proportions.  For example, if you click on April 2012, and select View Data, you get
tab


which is unlikely to improve anyone’s understanding of the poll.

I like interactive graphics.  I’ve put a lot of time and effort into making interactive graphics.  I’ve linked to a lot of good interactive graphics on this blog. The Herald has the opportunity to show the usefulness of interactive graphics to a much wider community that I’ll ever manage. But not this way.
March 20, 2013

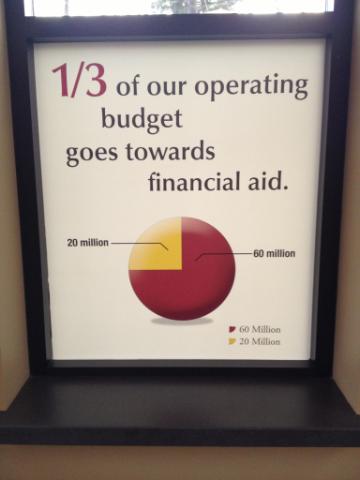
Frontiers in piecharts

From Bradley Voytek, apparently from Reddit, but unfortunately not further sourced there either

hHm8uJ0


I think the legend at the bottom right just makes this perfect.

The revolution in basketball analytics

From the Grantland blog at ESPN

New technology and statistics will change the way we understand basketball, even if they also create friction between coaches and front-office personnel trying to integrate new concepts into on-court play. The most important innovation in the NBA in recent years is a camera-tracking system, known as SportVU, that records every movement on the floor and spits it back at its front-office keepers as a byzantine series of geometric coordinates. Fifteen NBA teams have purchased the cameras, which cost about $100,000 per year, from STATS LLC; turning those X-Y coordinates into useful data is the main challenge those teams face.

Some teams are just starting with the cameras, while others that bought them right away are far ahead and asking very interesting questions. Those 15 teams have been very secretive in revealing how they’ve used the data, but one team that has made serious progress — the Toronto Raptors — opened up the black box in a series of meetings this month with Grantland.

The Raptors do have a current record of 26-41, so there seem to be limits to what the analytics can achieve…

Big Data is not enough

There’s a good piece in one of the New Yorker‘s blogs  about the Human Connectome Project and the proposed Brain Activity Map.  The Connectome project has produced two terabytes of functional and structural data on the brains of 68 volunteers, and the Brain Activity Map is more or less what it says on the tin.

Almost certainly people will be able to do something useful with all this data, but some of the claims for what it means to our understanding of the brain are a bit much. As the RealClearScience blog points out (in a slightly different context), we know the complete nervous system of the nematode C. elegans.  We know every cell and all its connnections to other cells.  We still can’t use this knowledge to reliably predict the nematode’s behaviour even by brute-force simulation, let alone by sophisticated analysis.

Simply using Big Data to work out how a complex system functions requires a lot of simplifying assumptions to be true.  This isn’t because we’re not smart enough to build more complex models (though we’re not), and it isn’t because the computation is beyond us (though it is), it’s a fundamental limitation on learning without an underlying theory to help you.

The way Amazon or Netflix does prediction with all its data is to look for a large group of people who are similar to you, in relevant ways, and see what they bought or watched. That sounds easy, but the weasel words are ‘in relevant ways’.  If you have a moderately large number of variables, there are far too many ways in which people, or nerve signals, or protein concentrations could be similar, and you need to decide which ones are relevant.   This is critical, because finding the true relationships in large numbers of associations is only possible if nearly all the associations are zero; in current jargon, the model is ‘sparse’.

In order to see sparseness, you need to know how to look.    Consider the economy: if you just look at associations between measurements, everything is correlated: you see inflation, you see population growth,  you see seasonal variation.  These patterns need to be removed to get a sparse model where you’ve got some hope of disentangling cause and effect.

In really complex fields like brain activity, we don’t know enough about how to pose the problem so that Big Data will have a hope of solving it.


NRL Predictions, Round 3

Team Ratings for Round 3

Here are the team ratings prior to Round 3, along with the ratings at the start of the season. I have created a brief description of the method I use for predicting rugby games. Go to my Department home page to see this.

Current Rating Rating at Season Start Difference
Storm 12.77 9.73 3.00
Sea Eagles 7.88 4.78 3.10
Cowboys 6.23 7.05 -0.80
Bulldogs 5.30 7.33 -2.00
Rabbitohs 5.30 5.23 0.10
Titans 1.65 -1.85 3.50
Knights 0.29 0.44 -0.10
Broncos 0.01 -1.55 1.60
Sharks -0.95 -1.78 0.80
Dragons -3.05 -0.33 -2.70
Raiders -3.83 2.03 -5.90
Panthers -4.72 -6.58 1.90
Wests Tigers -5.29 -3.71 -1.60
Eels -6.04 -8.82 2.80
Roosters -6.75 -5.68 -1.10
Warriors -12.53 -10.01 -2.50


Performance So Far

So far there have been 16 matches played, 12 of which were correctly predicted, a success rate of 75%.

Here are the predictions for last week’s games.

Game Date Score Prediction Correct
1 Eels vs. Bulldogs Mar 14 16 – 20 -7.54 TRUE
2 Dragons vs. Broncos Mar 15 6 – 22 5.80 FALSE
3 Cowboys vs. Storm Mar 16 10 – 32 2.95 FALSE
4 Warriors vs. Roosters Mar 16 14 – 16 -1.10 TRUE
5 Titans vs. Raiders Mar 17 36 – 0 3.48 TRUE
6 Wests Tigers vs. Panthers Mar 17 28 – 18 2.42 TRUE
7 Sea Eagles vs. Knights Mar 17 32 – 0 7.12 TRUE
8 Rabbitohs vs. Sharks Mar 18 14 – 12 12.93 TRUE


Predictions for Round 3

Here are the predictions for Round 3. The prediction is my estimated expected points difference with a positive margin being a win to the home team, and a negative margin a win to the away team.

Game Date Winner Prediction
1 Storm vs. Bulldogs Mar 21 Storm 12.00
2 Wests Tigers vs. Eels Mar 22 Wests Tigers 5.30
3 Titans vs. Sea Eagles Mar 23 Sea Eagles -1.70
4 Roosters vs. Broncos Mar 23 Broncos -2.30
5 Sharks vs. Warriors Mar 24 Sharks 16.10
6 Panthers vs. Rabbitohs Mar 24 Rabbitohs -5.50
7 Raiders vs. Dragons Mar 24 Raiders 3.70
8 Knights vs. Cowboys Mar 25 Cowboys -1.40


Super 15 Predictions, Round 6

Team Ratings for Round 6

This year the predictions have been slightly changed with the help of a student, Joshua Dale. The home ground advantage now is different when both teams are from the same country to when the teams are from different countries. The basic method is described on my Department home page.

Here are the team ratings prior to Round 6, along with the ratings at the start of the season.

Current Rating Rating at Season Start Difference
Chiefs 8.92 6.98 1.90
Crusaders 7.80 9.03 -1.20
Brumbies 4.68 -1.06 5.70
Stormers 3.09 3.34 -0.20
Sharks 2.56 4.57 -2.00
Hurricanes 2.21 4.40 -2.20
Bulls 2.03 2.55 -0.50
Blues 0.26 -3.02 3.30
Reds -1.69 0.46 -2.20
Cheetahs -4.20 -4.16 -0.00
Highlanders -5.64 -3.41 -2.20
Waratahs -6.54 -4.10 -2.40
Force -8.60 -9.73 1.10
Kings -8.89 -10.00 1.10
Rebels -10.77 -10.64 -0.10


Performance So Far

So far there have been 28 matches played, 19 of which were correctly predicted, a success rate of 67.9%.

Here are the predictions for last week’s games.

Game Date Score Prediction Correct
1 Highlanders vs. Hurricanes Mar 15 19 – 23 -5.60 TRUE
2 Waratahs vs. Cheetahs Mar 15 26 – 27 2.20 FALSE
3 Kings vs. Chiefs Mar 15 24 – 35 -14.30 TRUE
4 Crusaders vs. Bulls Mar 16 41 – 19 7.40 TRUE
5 Reds vs. Force Mar 16 12 – 19 12.50 FALSE
6 Sharks vs. Brumbies Mar 16 10 – 29 5.90 FALSE


Predictions for Round 6

Here are the predictions for Round 6. The prediction is my estimated expected points difference with a positive margin being a win to the home team, and a negative margin a win to the away team.

Game Date Winner Prediction
1 Chiefs vs. Highlanders Mar 22 Chiefs 17.10
2 Crusaders vs. Kings Mar 23 Crusaders 20.70
3 Reds vs. Bulls Mar 23 Reds 0.30
4 Force vs. Cheetahs Mar 23 Cheetahs -0.40
5 Sharks vs. Rebels Mar 23 Sharks 17.30
6 Stormers vs. Brumbies Mar 23 Stormers 2.40
7 Waratahs vs. Blues Mar 24 Blues -2.80


It’s still dry

The NIWA soil moisture maps from March 10 and yesterday show how much difference a single storm doesn’t make:

niwa-now niwa-then


It’s a good thing there are date labels to distinguish them.