March 19, 2013

How could this possibly go wrong?

There’s a new research paper out that sequences the genome of one of the most important cancer cell lines, HeLa.  It shows the fascinating genomic mess that can arise when a cell is freed from the normal constraints against genetic damage, and it gives valuable information about a vital research resource.

However, the discussion on Twitter (or at least the parts I frequent) has been dominated by another fact about the paper.  The researchers apparently didn’t consult at all with the family of Henrietta Lacks, the person whose tumour this originally was.  There are two reasons this is bad.

Firstly, publishing a genome of  an ancestor of yours allows people to learn a lot about your genome. The high levels of mutation in the cancer cell line reduces this information a bit, but there’s still a lot there. As a trivial example, even without worrying about genetic disease risks, you could use the data to tell if someone who thought they were a descendant of Ms Lacks actually was or wasn’t. Publishing a genome without consent from, or consultation with, anyone is at best rude.

And secondly: come on, guys, didn’t you read the book? From the author’s summary

In 1950, Henrietta Lacks, a young mother of five children, entered the colored ward of The Johns Hopkins Hospital to begin treatment for an extremely aggressive strain of cervical cancer. As she lay on the operating table, a sample of her cancerous cervical tissue was taken without her knowledge or consent and given to Dr. George Gey, the head of tissue research. Gey was conducting experiments in an attempt to create an immortal line of human cells that could be used in medical research. Those cells, he hoped, would allow scientists to unlock the mysteries of cancer, and eventually lead to a cure for the disease. Until this point, all of Gey’s attempts to grow a human cell line had ended in failure, but Henrietta’s cells were different: they never died.

Less than a year after her initial diagnosis, Henrietta succumbed to the ravages of cancer and was buried in an unmarked grave on her family’s land. She was just thirty-one years old. Her family had no idea that part of her was still alive, growing vigorously in laboratories—first at Johns Hopkins, and eventually all over the world.

That’s how they did things back then.  It’s not how we do things now. If there was a symbolically worse genome to sequence without some sort of consultation, I’d have a hard time thinking of it.

I don’t think anyone’s saying laws or regulations were violated, and I’m not saying that the family should have had veto power, but they should at least have been talked to.
Another dimension for graphics

We’ve encountered Karl Broman before, for his list of the top ten worst graphs in the scientific literature.  He also has some nice examples of interactive scientific graphics, both stand-alone and embedded in slides for talks.

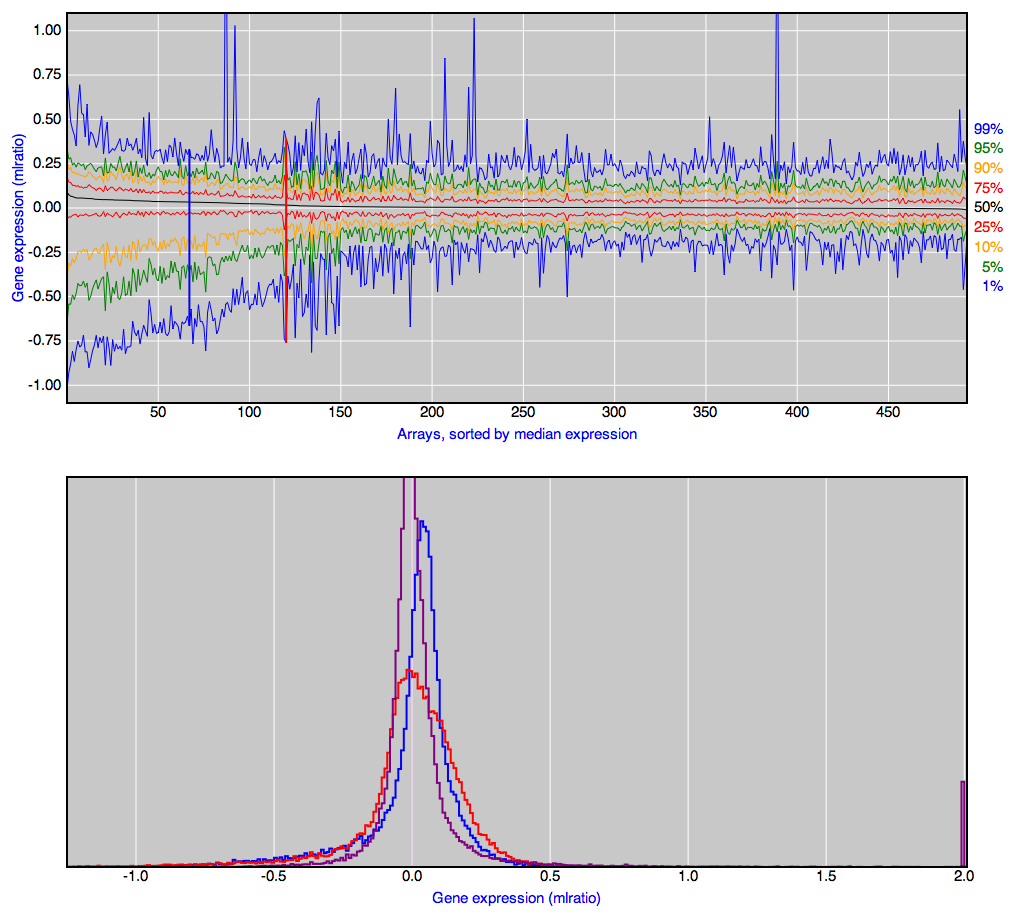
One example: 500 boxplots of gene expression ratios (no, you don’t need to know or care what these are).  The top panel shows minimum, maximum, median, quartiles, and as you move the mouse along, the bottom panel shows the whole distribution.  Click, and the distribution stays in the bottom panel for comparison with others.

boxplots


Karl, on Twitter, has also recommended a column on visualisation in the journal Nature Methods, but it’s not open-access, sadly.

March 18, 2013

Psychic bargraphs

Promoted from comments: Steve Black

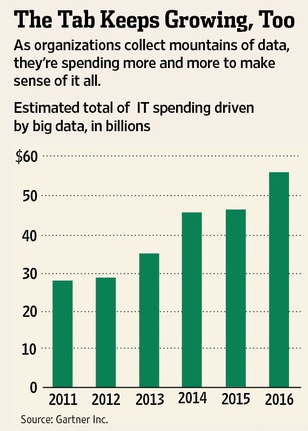
In the Wall St Journal article there is a graphic which does an excellent example of showing why you have to be careful. 

futurespend

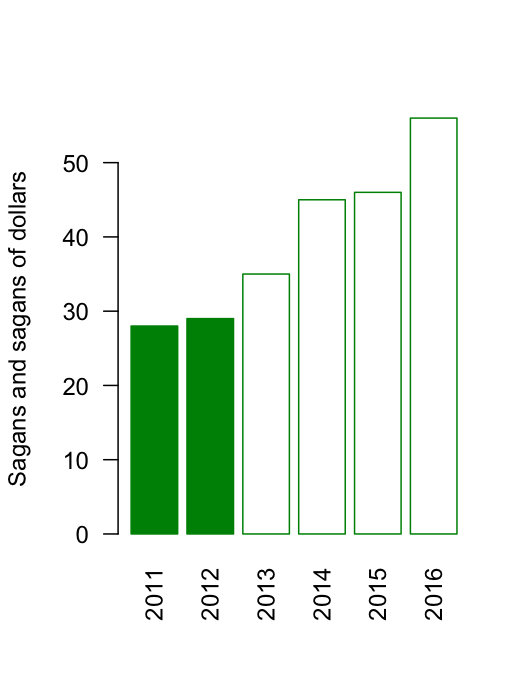
So what we’re looking at is that 2011 and 2012 are real. All the rest are made up. And it looks like they made up the trend for 2014-2016 from the pattern of 2011-2013 (two about the same, next two higher) even though 2013 itself is not yet a quarter over. Less than a concrete example?

Yup. I should have noticed that one.

Standard practice is to use a different colour or shading for imaginary numbers:

psychic

Stat of the Week Competition: March 16 – 22 2013

Each week, we would like to invite readers of Stats Chat to submit nominations for our Stat of the Week competition and be in with the chance to win an iTunes voucher.

Here’s how it works:

  • Anyone may add a comment on this post to nominate their Stat of the Week candidate before midday Friday March 22 2013.
  • Statistics can be bad, exemplary or fascinating.
  • The statistic must be in the NZ media during the period of March 16 – 22 2013 inclusive.
  • Quote the statistic, when and where it was published and tell us why it should be our Stat of the Week.

Next Monday at midday we’ll announce the winner of this week’s Stat of the Week competition, and start a new one.

(more…)

March 17, 2013

To trend or not to trend

David Whitehouse through the Global Warming Policy Foundation has recently released a report stating that “It is incontrovertible that the global annual average temperature of the past decade, and in some datasets the past 15 years, has not increased”. In case it is unclear, both the author and institute are considered sceptics of man-made climate change.

The report focuses on arguing the observation that if you look at only the past decade then there is no statistically significant change in global average annual temperature. Understanding what this does, or doesn’t, mean requires considering two related statistical concepts; 1) significant versus non-significant effects and 2) sample size and power.

Detecting a change is not the same as detecting no change. Statistical tests, indeed most of science, generally operates around Karl Popper’s falsification. Null hypotheses are set-up, generally a statement or test of the form ‘there is no effect’ and the alternative hypothesis is set-up in the contrary ‘there is an effect’. We then set-out to test these competing hypotheses. What is important to realise, however, is that technically one can never prove the null hypothesis, only gather evidence against it. In contrast however one can prove the alternative hypothesis. Scientists generally word their results VERY precisely. As a common example, imagine we want to show there are no sharks in a bay (our null hypothesis). We do some surveys, and eventually one finds a shark. Clearly our null hypothesis has been falsified, as finding a shark proves that there are sharks in the bay. However, let’s say we do a number of surveys, say 10, and find no sharks. We don’t have any evidence against our null hypothesis (i.e. we haven’t found any sharks..yet), but we haven’t ‘proven’ there are no sharks, only that we looked and didn’t find any. What if we increased it to say 100 surveys? That might be more convincing, but once again we can never prove there are no sharks, only demonstrate that after a large number of surveys (even 1,000, or 1,000,000) its highly unlikely there are any. In other words, as we increase our sample size, we have more ‘power’ (a statistical term) to be confident that they represent the underlying truth.

And so in the case of David Whitehouse’s claim we see similar elements. Just because an analysis of the last decade of global temperatures does not find a statistically significant trend, does not prove there is none. It may mean there has been no change, but it might also mean that the dataset is not large enough to detect it (i.e. there is not enough power). Furthermore, by reducing your dataset (i.e. only looking at the last 10 years rather than 30) you are reducing your sample size, meaning you are MORE likely NOT to detect an effect. A cunning statistical sleight of hand to make evidence of a trend disappear.

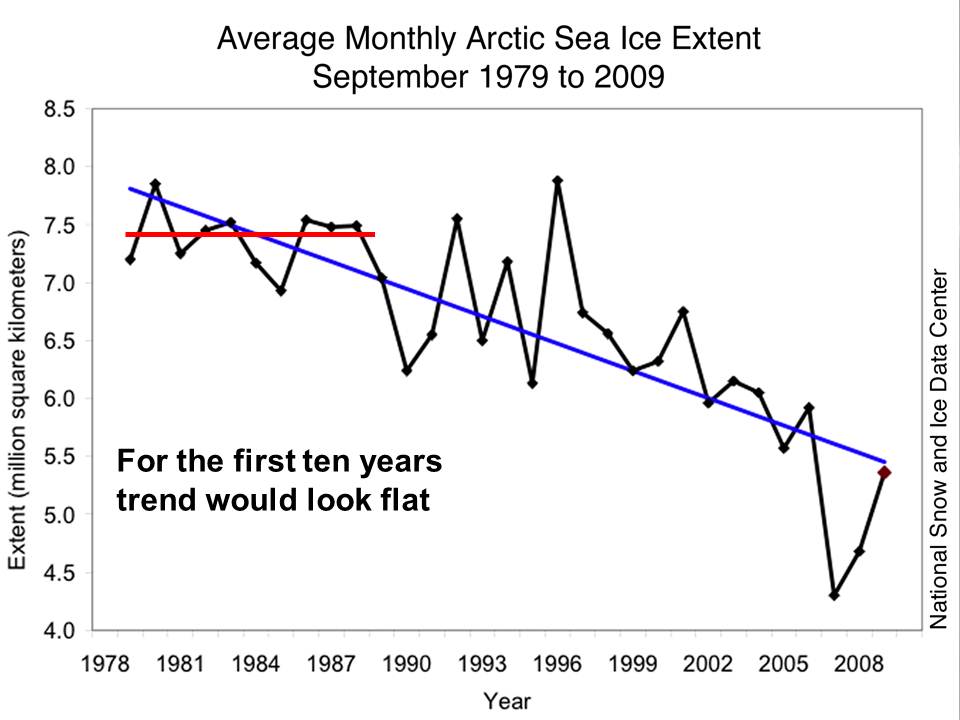
I lecture these basic statistical concepts to my undergraduate class and demonstrate it graphically. If you put a line over any ten years of data, it probably could be flat, only once you accumulate enough data, say thirty years, does the extent of the trend become clear.

Arctic sea ice 1979-2009

Demonstrates the difficulty in detecting long-term trends with noisy data

This point is actually noted by the report (e.g. see Fig. 16).

Essentially, the only point that the report makes is that if you look at a small part of the dataset (less than a few decades), you can’t make a statistically robust conclusion, since you will be within a low power margin of error. Most importantly, we must be able to detect trends early even when the power to detect them may be low. And as I have stated in earlier posts, changes in variability are as important a metric as changes in the average, and the former, which is predicted from climate change, will make detecting the latter, which is also predicted, even more difficult.

Briefly

  • When data gets more important, there’s more incentive to fudge it.  From the Telegraph: ” senior NHS managers and hospital trusts will be held criminally liable if they manipulate figures on waiting times or death rates.”
  • A new registry for people with rare genetic diseases, emphasizing the ability to customise what information is revealed and to whom.
  • Wall St Journal piece on Big Data. Some concrete examples, not just the usual buzzwords
  • Interesting visualisations from RevDanCat
March 16, 2013

Where survey stories come from

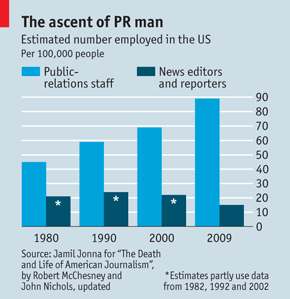
The ‘flack:hack’ ratio, the ratio of PR professionals to journalists, has been steadily increasing over time.  This graph, from the Economist, shows that the ratio in the US has  now reached 9:1.

20110521_wbc750


As Felix Salmon says

for every professional journalist, there are nine people, some of them extremely well paid, trying to persuade that journalist to publish something about a certain company. That wouldn’t be the case if those articles weren’t worth serious money to the companies in question.

This explains a lot of ‘survey’ stories.  A no-frills 1000-person survey is not only cheaper than a half-page news-section ad in the Herald, if it gets a story it’s a lot more effective.  A story will be syndicated to the regional papers, it will be on the online site for ever, and we’re much more likely to read and trust it.

Do scientists read newspapers or blogs?

A new paper surveyed neuroscientists in Germany and the US about where they get information on science-related news stories.

Based on the response of some 250 scientists (fairly evenly divided between the countries), the researchers found that scientists tended to give more weight to the influence of traditional media. For instance, more than 90 percent of neuroscientists in both countries said they relied on traditional journalist sources – both in print and online – to follow news about scientific events compared to around 20 percent for blogs.

Not surprisingly, the internet coverage of this paper has been fairly hostile (traditional media seems not to have covered it).

There’s a good  summary of the reaction by science writer Deborah Blum, but count me on the bemused side.  I do use traditional media to learn that particular science stories exist, but rarely to find out more about them.

March 15, 2013

Policing the pollsters … your input sought

This is from Kiwiblog:

A group of New Zealand’s leading political pollsters, in consultation with other interested parties, have developed draft NZ Political Polling Guidelines.

The purpose is to ensure that Association of Market Research Organisations and Market Research Society of New Zealand members conducting political polls, and media organisations publishing poll results, adhere to the highest “NZ appropriate” standards. The guidelines are draft and comments, questions and recommendations back to the working group are welcome.

This code seeks to document best practice guidelines for the conducting and reporting of political polls in New Zealand. It is proposed that the guidelines, once approved and accepted, will be binding on companies that are members of  AMRO and on researchers that are members of MRSNZ.

Briefly