December 18, 2012

Meet Shuran Yao – Statistics Summer Scholarship recipient

This summer, we have a number of fantastic students who received a Department of Statistics scholarship to work on fascinating projects with our staff members. We’ll be profiling them here on Stats Chat and we’d love to hear your feedback on their projects!

Shuran is working with Ilze Ziedins, Alan Lee and Geoffrey Pritchard on a research project entitled ‘Statistical assessment of telecommunications network performance metrics.’

Shuran explains:

Shuran Yao Statistics Scholarship 2012-2013“My summer research with Harmonic is more like an internship.

Harmonic provides smart solutions using advanced analytics tool R to energy sectors, telecommunications and also agriculture industries.

One of the projects I am involved in is about analysis of social networks to deliver customer insight. I will also be working on checking as well as editing the R training manual by adding some finance related cases.

More about Shuran:

“My primary major is Quantitative Finance. I’m also doing a second major in Statistics. Statistics is a really useful tool that is widely applied in various industries like actuarial science, finance, and telecommunications. The beauty is that it can explore and extract information from piles of numbers.”


December 17, 2012

Turkey arithmetic

Stuff’s story about the price of Christmas food has the headline “Festive food hits Kiwis’ wallets”, and the even more misleading HTML page title “Christmas Dinner Takes Bigger Dent from Wallets.”  The story says

A traditional Christmas dinner with roast chicken or lamb, seasonal vegetables, nibbles and pavlova will set you back about $67.31, up from $54.60 in 2002.

The problem, as usual with stories comparing past and current prices, is that dollars are smaller than they used to be.  In this case the CPI isn’t really the answer — $54.60 in 2002 money is worth about $70 in today’s money, but that just tells us Christmas dinner has gone up less than the average for the CPI basket of goods.

The dent in wallets really depends on how the price compares to income.  If the price had increased as fast as mean household income it would now be $76.38, if it had increased as fast as median household income it would now be $77.55, and if it had increased as fast as the minimum wage it would be $92.18 (StatsNZ, MoBIE).


Unscientific polls of scientists

The graph below is an overly-creative variation on barplots, which I think confirms the principle “if you want to write the data values on the graph, it’s probably a bad graph”.

Good thing it wasn't two hours

The data are supposed to be “time per day spent using mobile apps”.  Presumably it’s mean time per day, though I can’t tell whether the mean is restricted to people who spend non-zero time.  The graphs come from a “study” conducted by the “Science Advisory Board®”.  The “Science Advisory Board®” is an online survey panel for market research, where biomedical scientists are the market.  Or as they put it

The Board is an independent, worldwide panel of life science and medical professionals that convenes electronically to voice their opinions on a wide range of topics.

Here “convenes electronically” means “gets sent survey links by email”, and since I’m not a “member”, in my case this means spam about a survey on lab equipment.

The “Science Advisory Board®” homepage includes various things aimed at making their study samples feel like a community. There’s also widget that cycles through their past few days of Twitter feed at a rate of about one every five seconds, and, rather surprisingly for a company that wants to give the impression of solid opinion research, a clicky bogus poll™.

Briefly

  • A zombie story:  Stuff has an opinion piece about chocolate and intelligence, based on the joke article in the New England Journal of Medicine back in October. We covered what was wrong with it then, and showed that you get better correlation with the number of letters in the country’s name than with chocolate consumption.  [Update: the piece is really from an Australian publication, with a light makeover for the Kiwi audience.]
  • A better joke.  An article in the Canadian Medical Association Journal looks at the impact on clinical trials if the world ends on December 21, as the Mayan calendar does not give the slightest suggestion will happen.
  • Language Log examines the inability of journalists around the world to get the basic numbers right in reporting a study on water chlorination and allergies (a story that the NZ media seem to have had the good sense not to pick up).
  • “Good data-driven journalism both publishes as much data as possible, and uses the data to drive conclusions, rather than simply dropping numbers into a foreordained article.”  Felix Salmon, complaining about a New York Times story.
  • The American Statistical Association has a new prize for “Causality in Statistics Education”, aimed at encouraging the teaching of basic causal inference in introductory statistics courses.

Meet Viet Hoang Quoc – Statistics Summer Scholarship recipient

This summer, we have a number of fantastic students who received a Department of Statistics scholarship to work on fascinating projects with our staff members. We’ll be profiling them here on Stats Chat and we’d love to hear your feedback on their projects!

Viet is working with Thomas Yee on a research project entitled ‘Parameter estimation for selected univariate distributions.’

Viet explains:

Viet Hoang Quoc Statistics Scholarship Recipient 2012-2013“I’m working on various theoretical aspects (investigation of different types of distribution, implementation of new mathematical-based theories) and practical sides (data cleaning, issues in LaTeX and Sweave).

“I am digging into the some distribution theory and related properties (half-normal, truncated geometric, nearest neighbour and so on) in order to expand and diversify our current number of well-known distributions (normal, Poisson) …

“I’m also doing some practical work such as using various approaches to clean large data sets (e.g. removing outliers).

“Checking the functionality of VGLM and VGAM packages is also included in my summer research.”

More about Viet:

“I graduated from the Department of Mathematics majoring in Pure Mathematics along with two minors in Applied Mathematics and Statistics. Statistics has always been a significant interest simply because of its beautiful connection to multiple areas in life such as finance, economics, computer science and many more. Understanding statistics is also very helpful in daily life.

“I’m looking forward to going camping with friends over the Christmas/New Year period.”


Stat of the Summer Competition: December 15 2012 – March 1 2013

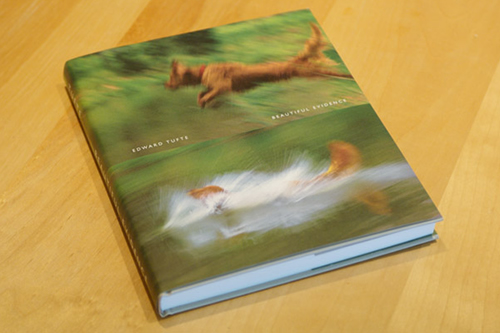
This summer, we would like to invite readers of Stats Chat to submit nominations for our Stat of the Summer competition and be in with the chance to win a copy of “Beautiful Evidence” by Edward Tufte:

Here’s how it works:

  • Anyone may add a comment on this post to nominate their Stat of the Summer candidate before midday Friday March 1 2013.
  • Statistics can be bad, exemplary or fascinating.
  • The statistic must be in the NZ media during the period of December 15 2012 – March 1 2013 inclusive.
  • Quote the statistic, when and where it was published and tell us why it should be our Stat of the Summer.

On Monday 4 March 2013 at midday we’ll announce the winner of the Stat of the Summer competition, and restart the weekly competition.

The fine print:

  • Judging will be conducted by the blog moderator in liaison with staff at the Department of Statistics, The University of Auckland.
  • The judges’ decision will be final.
  • The judges can decide not to award a prize if they do not believe a suitable statistic has been posted.
  • Only the first nomination of any individual example of a statistic used in the NZ media will qualify for the competition.
  • Individual posts on Stats Chat are just the opinions of their authors, who can criticise anyone who they feel deserves it, but the Stat of the Week award involves the Department of Statistics more officially. For that reason, we will not award Stat of the Week for a statistic coming from anyone at the University of Auckland outside the Statistics department. You can still nominate and discuss them, but the nomination won’t be eligible for the prize.
  • Employees (other than student employees) of the Statistics department at the University of Auckland are not eligible to win.
  • The person posting the winning entry will receive a copy of “Beautiful Evidence” by Edward Tufte.
  • The blog moderator will contact the winner via their notified email address and request their postal address for the book to be sent to.
  • The competition will commence Saturday 15 December 2012 and continue until midday Friday 1 March 2013.
December 16, 2012

Meet Daisy Shepherd – Statistics Summer Scholarship recipient

This summer, we have a number of fantastic students who received a Department of Statistics scholarship to work on fascinating projects with our staff members. We’ll be profiling them here on Stats Chat and we’d love to hear your feedback on their projects!

Daisy is working with Steffen Klaere on a research project entitled ‘What drives a phylogenetic inference?’

Daisy explains:   

Daisy Shepherd Statistics Scholarship 2012-2013“Phylogenetic inference aims at deriving the most likely ancestry of a set of species, as well as information relating to evolutionary speed and potential related events. It is an important process in which we wish to classify the history of an organism, but we don’t know that history. Thus, we must infer the evolutionary transformations that have taken place, to provide the best estimate of the true phylogeny.

“However, there is one unresolved question in this field – how do we measure the goodness of fit between an inferred model and the actual data we have been provided with? This question remains as a significant area of uncertainty within the major world of phylogenetic inference.

“Thus, the project aims at developing methods that identify data points as outliers. This will allow us to further develop our understanding of whether a suggested ancestry is actually an ideal candidate for a specific organism’s genetic data.”

More about Daisy:

“I am very grateful to have been given this project over summer, and am extremely excited to enter into a different learning environment other than undergraduate study.  Having completed my Bachelor of Science majoring in Mathematics and Statistics, I am returning in 2013 for an Honours programme.  Ever since high school, I have always been fascinated by the logic and nature of these subjects, which naturally led me to studying them at university.  As I ventured through my degree, I further developed my enthusiasm for statistics and increased my awareness of its significance not only within practical situations, but also within everyday real-life situations.

“Outside of my project, I am excited to be reunited with my brother visiting from England, who I have not seen for almost four years!  Hopefully I will be exploring more of New Zealand’s beautiful scenery, and shall be attempting to tan my consistently stubborn, pale English skin.”

December 15, 2012

Meet Nur Azizah Komara Rifai – Statistics Summer Scholarship recipient

This summer, we have a number of fantastic students who received a Department of Statistics scholarship to work on fascinating projects with our staff members. We’ll be profiling them here on Stats Chat and we’d love to hear your feedback on their projects!

Nur Azizah Komara Rifai is working with Yannan Jiang on a research project entitled ‘Trends in typical food portion sizes consumed by New Zealand adults.’

Azizah explains:   

Nur Azizah Komara Rifai Statistics Scholarship 2012-2013 “There is an urgent public health need to reduce obesity. Research from other countries indicates food portion sizes have been increasing parallel with rates of obesity, and are an important contributory factor. But no information currently exists on how New Zealand adults’ food portion sizes are changing over time.

“Data from the National Nutrition Survey in 1997 and 2008/09 will be cleaned, categorised and then analysed using R. I’m interested in using statistics to determine trends in food portion sizes over time and then disseminating those findings to the public.”

More about Azizah:

“I’m from Indonesia. I am studying statistics at Padjadjaran University in Bandung,  the capital of West Java province in Indonesia, and will be travelling to New Zealand to take up the scholarship.

“I experienced a critical period in my life when I was accepted into both my dream course in statistics at Padjadjaran University (despite the prohibitive cost) and the  Chemical Analysts Academy in Bogor (at much cheaper cost). I had to choose between the two, but the decision was made much tougher because my family was hit by the financial crisis.

“I did not want to be selfish with my personal desires, but I also did not want to underestimate my future. It was a very difficult struggle to persuade my parents that I should choose statistics and that it had excellent employment prospects. We prayed for a miracle to pay for the course and finally we solved it.  While I’m unable to pay or replace the struggles my parents went through to get me there, I was able to give them the gift of scoring a perfect 4.00 GPA.”

“I like traditional food like lalap and sambal, watching television, playing the keyboard, drawing, hanging out with my friends, sport (futsal, jogging, badminton, swimming, gymnastics), and reading textbooks.”


Experiment with your vegetables

The Herald has a story on anticancer compounds in broccoli that is actually pretty good. Even the headline only says “Broccoli compound can kill cancer”.

Like all early-stage lab research, the findings will almost certainly not lead to improved treatments, and they don’t provide an additional reason to eat broccoli, but the story does describe what the research found.

December 14, 2012

Meet Richard Hopkins – Statistics Summer Scholarship recipient

This summer, we have a number of fantastic students who received a Department of Statistics scholarship to work on fascinating projects with our staff members. We’ll be profiling them here on Stats Chat and we’d love to hear your feedback on their projects.

Richard Hopkins is working with Paul Murrell on a research project entitled ‘Voronoi treemaps in R’.

Richard explains:

Richard Hopkins Statistics Scholarship “A Voronoi treemap is a graphical, non-rectangular representation of hierarchical data. Voronoi Treemaps are often used to represent population data (subdivisions within the Voronoi treemap represent elements of the population and their respective weights). There are currently algorithms in place that allow a user to generate Voronoi treemaps; however, the algorithms are slow and unstable.

“The purpose of my project is to find ways to multi-thread or parallelise the code so that it can run faster. I will attempt to achieve this by doing the following:

  • Cleaning up and packaging the existing source code;
  • Modifying the code to allow for control of different start points for each sub-region;
  • Fine-tuning the NZ price Kaleidoscope example so that it accurately represents data and is aesthetically pleasing;
  • Running the code on high-performance machines to speed things up.

“I will also explore parameters of the algorithm to investigate current stability issues and any others that may arise during the course of the project.”

More about Richard:

“I was born and raised in Auckland. I am of New Zealand and Samoan heritage and I take pride in both sides. Last week, my wife and I celebrated two years of marriage. Although we don’t have children, we have a ton of immediate and extended family members to whom we devote lots of time. We are also heavily involved in our church. I enjoy a wide range of sports, especially basketball, power-lifting and grid iron.

“I recently completed a Bachelor of Science majoring in statistics and computer science. I have also been admitted to the 2013 Honours programme for statistics. I enjoy studying statistics because from a young age I have had an interest in recognising and analysing patterns and trends. I believe that studying statistics will enable me to turn my curiosity about numbers into useful skills, such as forecasting and data mining, that will hopefully benefit individuals, families and communities.”