September 12, 2012
Facts and factoids at your fingertips
Via Stuff: The Economist has released its World in Figures book as a free iPad and iPhone app.
Now what we need is an iPhone-friendly interface to Stats New Zealand’s Infoshare.
Via Stuff: The Economist has released its World in Figures book as a free iPad and iPhone app.
Now what we need is an iPhone-friendly interface to Stats New Zealand’s Infoshare.
Stuff’s story starts out
Half of all Kiwis like to change jobs regularly, with 51 per cent of people surveyed by online recruiter Seek starting their current role less than two years ago.
I don’t see why “like to change jobs regularly” is remotely the same as “have changed jobs recently”, and I’m sure people who were laid off in the recession or lost jobs to the ChCh quake would agree. But, more importantly, Stats New Zealand collects real data on changes of employment, so why not use that rather than a non-random sample from what Seek has in previous years described as “a broad online audience”.
In fact, Seek doesn’t do too badly in estimating: the true figure is 54%, with the difference being only about twice the margin of error for a random sample of the size of their previous years’ surveys.
As usual, I’m having to rely on previous years’ press releases for any methodology information, since Seek hasn’t posted this year’s one and Stuff isn’t giving any details.
A respectable survey in the US state of Ohio reports that Obama is still polling well. But it’s one of the secondary questions that is especially interesting: from Ezra Klein’s blog at the Washington Post
PPP asked voters who they thought deserved more credit for the killing of Osama bin Laden: Obama or Romney. 63 percent said Obama, 31 percent weren’t sure, and 6 percent said Romney.
The results for Republican voters were even more astonishing. 38 percent said Obama, 47 percent weren’t sure, and 15 percent said Romney. What the heck is going on?
As they go on to explain, this is an example of one of the big problems with opinion polls in situations where the respondents know what you are doing. The tendency is for people to answer in the way that represents their political affiliations rather than their actual opinions.
Two stories based on exactly the same data from the Real Estate Institute.
Modest revival for housing market: Stuff
Big jump in house prices: Herald
“Modest revival” is the press release description. The Herald has more sources and pretty interactive graphics showing more details.
The disagreement isn’t necessarily a bad thing: journalists should be doing interpretation, not just copying press releases. What is a bad thing is that no-one mentions inflation adjustment — Auckland’s ‘record’ median price is still way down from the peak when measured in constant dollars.
The Herald’s clicky poll accompanying the story on Kiwi self-satisfaction is a nice illustration of the unreliability of bogus polls (they’re only using it for entertainment, so that’s ok).
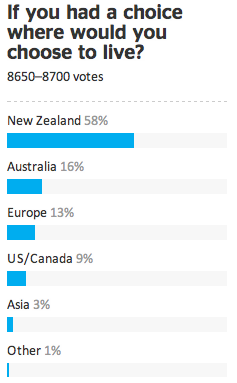
If the clicky poll was a real random sample, its margin of error would be about 1%. It isn’t, and it’s not.
Congratulations to Nick Iversen for her fantastic nomination of a “clinical trial” conducted by Dr. Oz with a great link to Science Based Medicine debunking the study.
James Curran noted that “it’s easy to loose 5lb in water even in the course of a day (on some bike rides in summer I will lose as much as 3-4kg on a 3 hour ride, and usually 1-2kg)”
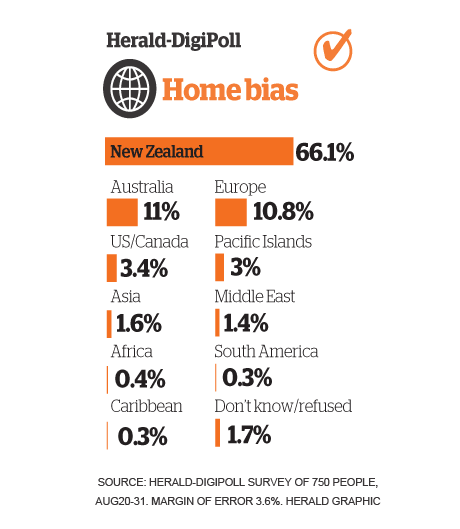
The new-look Herald has a good survey-based story on where people want to live: they did both in-depth interviews with a moderate number of people, and a reasonably good quantitative survey (online panel-based DigiPoll).
The results say that most people in New Zealand want to live here. In a sense that’s not surprising — they are living here — and that’s especially true for Australia as an alternative, since it’s not that difficult to move.
A similar US survey a couple of years ago, by the Pew Research Center, didn’t even bother to ask about other countries, just about other places to live in the US. It’s still a reasonable comparison: different parts of the US are more different than many countries, and some don’t even seem to be in the same universe as each other. In the Pew survey, nearly half of respondents said they wanted to live in a different kind of community from where they currently live. Several major cities had nearly 40% approval rating nationwide as somewhere people would like to live: Denver topped the list at 43%, and my previous home in Seattle was at 38%.
So, even accounting for the natural bias towards saying you have chosen the right place to live, Kiwis do seem happy with their home.
Each week, we would like to invite readers of Stats Chat to submit nominations for our Stat of the Week competition and be in with the chance to win an iTunes voucher.
Here’s how it works:
Next Monday at midday we’ll announce the winner of this week’s Stat of the Week competition, and start a new one.
Nate Silver, baseball statistician and election polling expert, has an article in the New York Times about weather forecasting and how it has improved much more than almost any other area of prediction:
In 1972, the service’s high-temperature forecast missed by an average of six degrees when made three days in advance. Now it’s down to three degrees. More stunning, in 1940, the chance of an American being killed by lightning was about 1 in 400,000. Today it’s 1 in 11 million. This is partly because of changes in living patterns (more of our work is done indoors), but it’s also because better weather forecasts have helped us prepare.
Perhaps the most impressive gains have been in hurricane forecasting. Just 25 years ago, when the National Hurricane Center tried to predict where a hurricane would hit three days in advance of landfall, it missed by an average of 350 miles. … Now the average miss is only about 100 miles.
The reasons are important in the light of today’s Big Data hype: meterologists have benefited from better input data, but more importantly from better models. Today’s computers can run more accurate approximations to the fluid dynamics equations that really describe the weather. Blind data mining couldn’t have done nearly as well. (via)
Stuff reports that 97 per cent of those aged 18-29 are saving for something. This is attributed to RaboBank
The myth of feckless youth which does not understand the value of money should be laid to rest, new research from online deposit bank RaboDirect suggests.
and you now know everything they’re prepared to admit about how the survey was done.
There isn’t a press release up at RaboBank yet, but the previous press release (from May) is about another survey. It also says nothing about methodology. There is a link to a PDF, which might have had more details, but it has been taken down.
With more searching I found a RaboBank press release from 2010 that did still have it’s ‘full survey results’ PDF link up — it has lots of colorful bar charts, and while it still doesn’t say anything about how the data were collected, the footnotes to the graphs include sample sizes and a little magenta logo that suggests the data were collected by market research firm TNS and were probably some sort of online panel. So that Rabobank survey wasn’t totally bogus — there’s disagreement about the accuracy of this approach, but at least it is trying to get the right answer.
So, it could be that the youth saving survey is also plausible. Or not. Hard to tell, really. And that’s before you dig into what “saving for something” might mean — is it actual money-in-the-bank or a New Year’s resolution.
Recent comments