September 3, 2012
Stat of the Week Winner: August 25 – 31 2012
Congratulations to Mark Bellhouse for his nomination of good reporting of a drug use study. Thomas Lumley also posted about the story here.
Congratulations to Mark Bellhouse for his nomination of good reporting of a drug use study. Thomas Lumley also posted about the story here.

That’s a five-set Venn diagram, invented in 1975. Some mathematicians have just worked out how to do an 11-set one.
These are pretty, and a computational and mathematical achievement, but unfortunately they don’t have any of the properties that make Venn diagrams a marginally-useful visualization method. (via)
Andrew Gelman, of Columbia University, wrote an article a few months ago called “Statistics for Cigarette Sellers”
Remember How to Lie with Statistics? It turns out the author worked for the cigarette companies… It appears he was also working on a book in the late 1960s called How to Lie with Smoking Statistics, which the publisher saw “high likelihood of proceeding into print.”
His blog has a largely overlapping post, but with a bit more material (and discussion in comments).
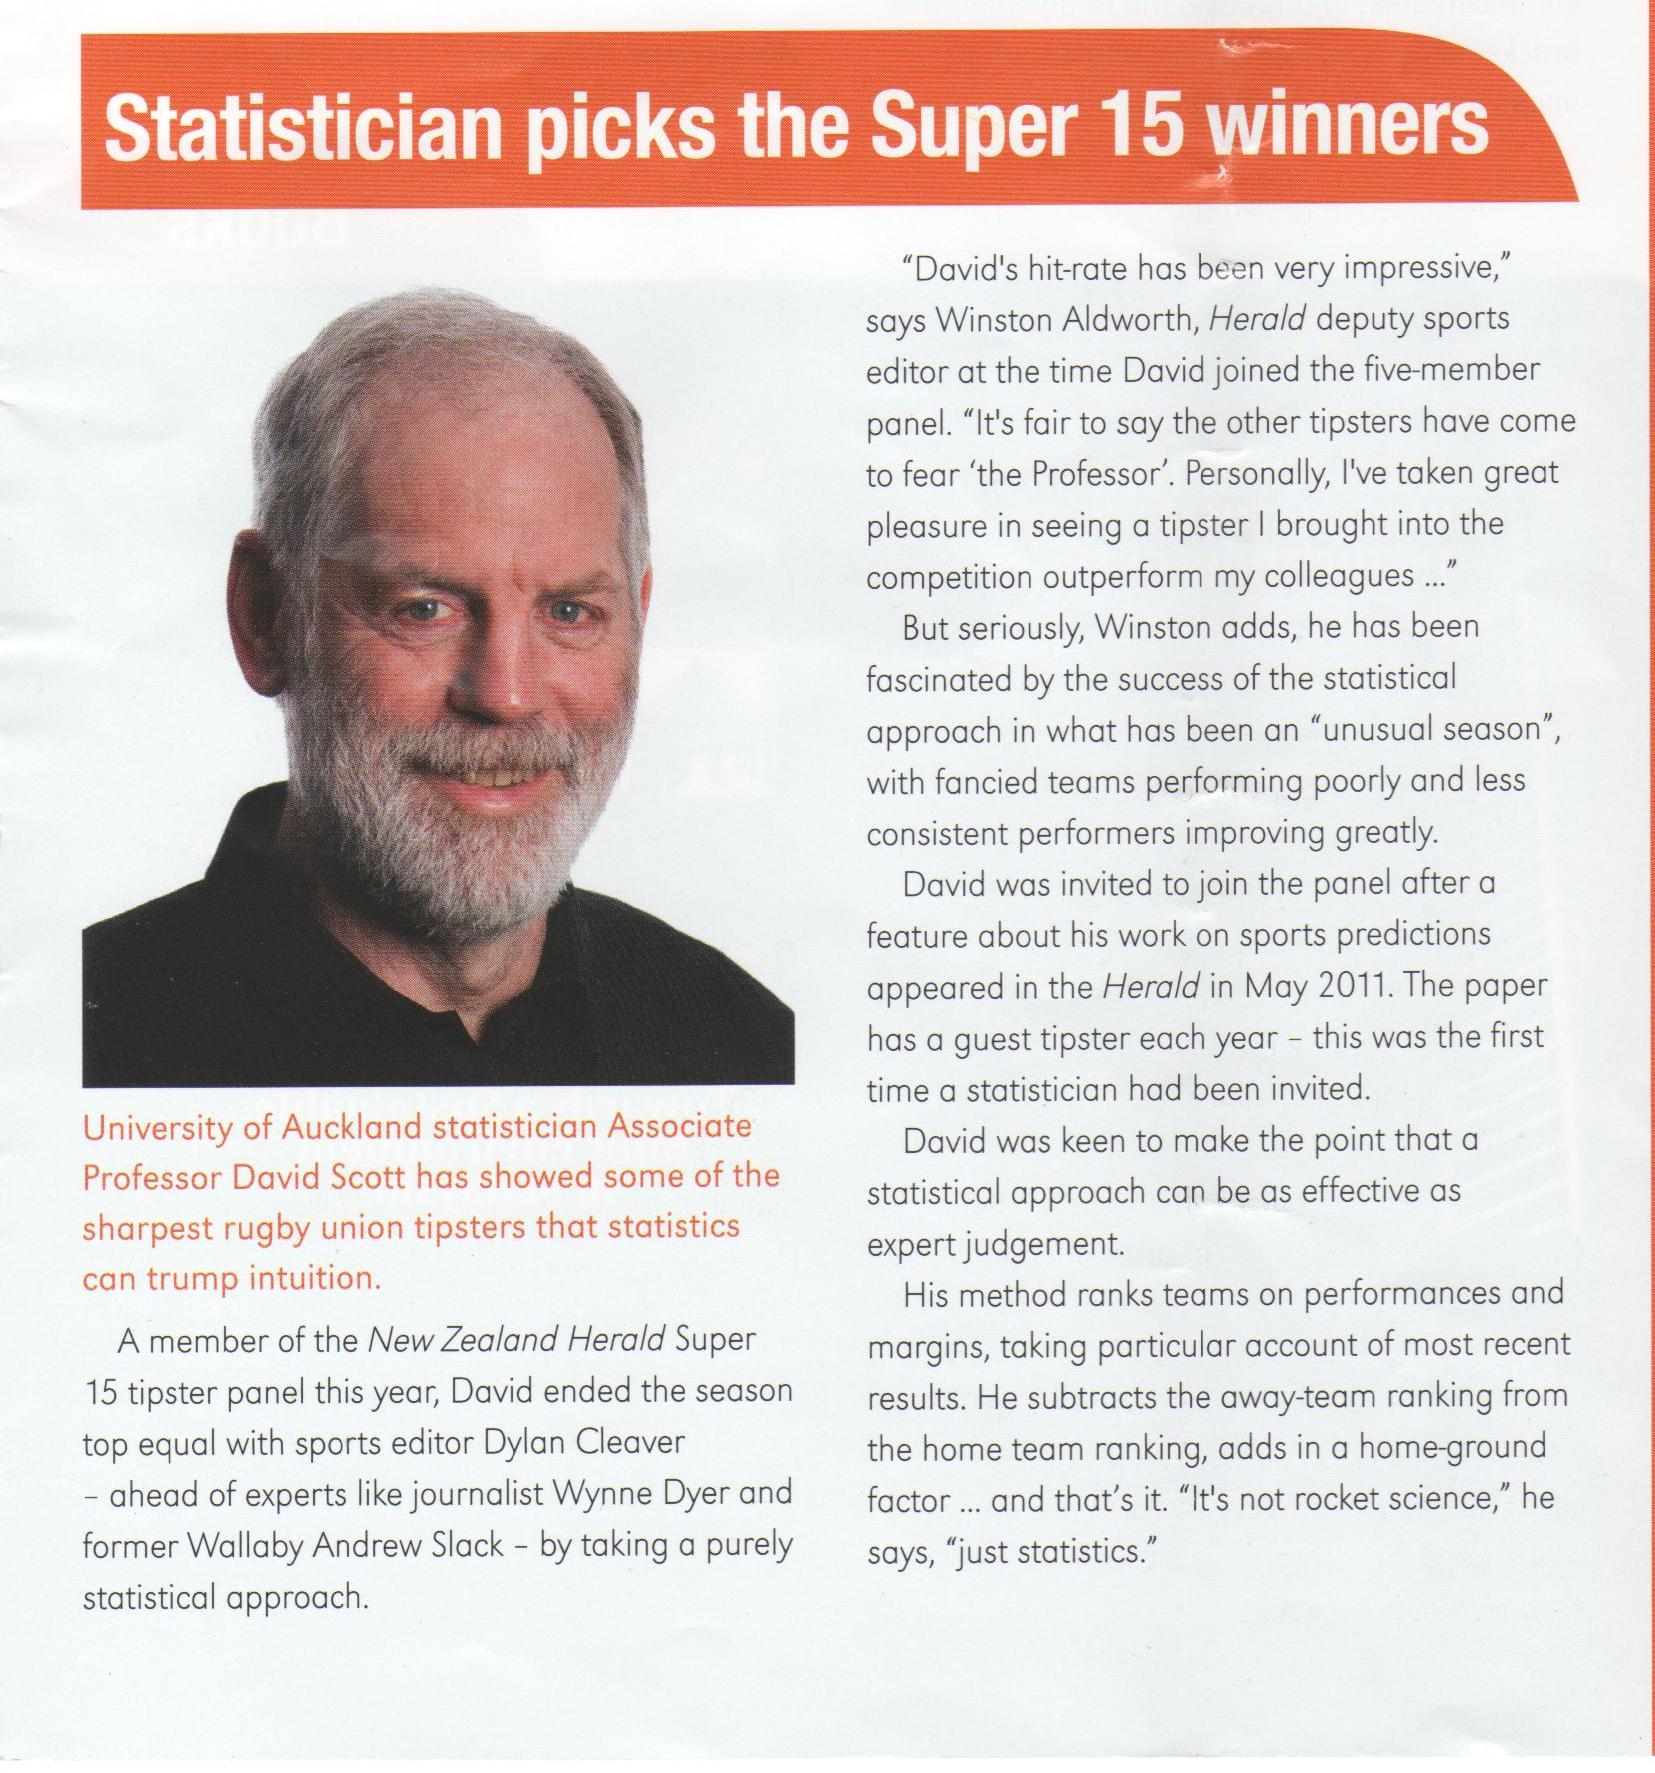
This appeared in Uni News, the internal University of Auckland magazine sent to a wide outside audience, a week or so after the end of the Super 15. David came top equal with sports writer Dylan Cleaver, and says he’ll be spending time over this summer “looking at some possible improvements to the prediction method”. Watch this space!
Each week, we would like to invite readers of Stats Chat to submit nominations for our Stat of the Week competition and be in with the chance to win an iTunes voucher.
Here’s how it works:
Next Monday at midday we’ll announce the winner of this week’s Stat of the Week competition, and start a new one.
An annoying trope in US political stories (which, fortunately, hasn’t made it here yet) is to criticise a politician for using too many first person singular pronouns — saying “I” and “me” too often. These stories often get analysed by the computational linguists over on Language Log, who tiredly point out that the claim is (a) largely irrelevant to the point being made, and (b) false.
This week’s example is the speech by New Jersey Governor Chris Cristie at the Republican National Convention. A New York Times piece said
Gov. Chris Christie is getting rave reviews today for his performance at the National Republican Convention, and there’s no doubt in my mind that he did a huge amount of good for the three most important people in his life – he, himself, and him….
By my count, Mr. Christie used the word “Romney” six times in his address. He used the word “I” 30 times, plus a couple of “me’s” and “my’s” tossed in for seasoning.
but as Mark Liberman points out, the actual use of first person singular pronouns was slightly lower than in the speeches by Paul Ryan, Anne Romney, Rick Santorum, Mike Huckabee, and much lower than Clint Eastwood. It’s also slightly lower than in the similar speech by (then Illinois Senator) Barack Obama at the 2004 Democratic Convention.
Since newspapers almost exclusively cover positive results in medical research, it’s easy to have an unrealistically optimistic view of progress. Most weeks, there are multiple stories about some new compound or extract that kills cancer cells in the lab, but we don’t learn what happens later. And no, these treatments aren’t suppressed by evil multinational drug companies, who are actually in desperate need of new things to sell us. As a partial corrective, here are some relatively recent research findings that make it less likely we’ll soon get new treatments for important diseases.
Alzheimer’s: trials of two antibodies against amyloid plaques, which had shown promise in mice, failed to show benefits in patients (one was robustly null, the other was borderline and the company hasn’t quite given up hope). Inhibiting one of the enzymes that makes amyloid has also failed.
Heart disease: Raising ‘good’ HDL cholesterol was a big hope, but three separate approaches to treatment have so far failed to provide any convincing benefit in clinical trials, and genetic studies suggest that although HDL is associated with lower risk, it may not actually be responsible for the reduction.
Diabetes: drugs to reduce insulin resistance through a new target called PPAR were going to be the new revoluation. Troglitazone and rosiglitazone (Avandia) got into use but turned out not to actually reduce complications of diabetes, several others didn’t make it past clinical trials. An even more promising approach was to inhibit one of the transporter proteins in the kidney, and dump all the excess glucose in urine. It didn’t work either.
One piece of good news as balance: a very promising new antibiotic for tuberculosis has succeeded in a phase II trial of drug-resistant TB. The trial looked at how fast patients became non-contagious, and the new antibiotic got more patients to that state, faster. The next step, just about to start, is a longer trial to see if patients are actually cured — it could still fail, of course.
One of the problems in medical research, exacerbated by the new ability to measure millions of genetic variables at once, is that you can always divide people into sensible subgroups.
If your treatment doesn’t work, or your hated junk food isn’t related to cancer, overall, you can see if the relationship is there in men or in women. Or in younger or older people. Or in Portugese-speaking bassoonists. The more you chop up the data, the more likely you are to find some group where there’s a difference. You can then focus on that group in your results.
To combat this tendency, my Seattle colleague Noel Weiss has been promoting the slogan “conclusions of difference require evidence of difference”. That is, if you want to report that cupcakes cause cancer in men but not in women, you need evidence that the relationship is different in men and in women. Finding supportive evidence in men but not finding it in women isn’t enough: that’s not evidence of a difference. Needing evidence of a difference is especially important when you wouldn’t expect a difference. We expect most things to have basically similar effects in men and women, and where the effects are different there’s usually an obvious reason.
All this is leading up to a story in the Herald, where a group of genetics researchers claim that a well-studied variant in a gene called monoamine oxidase increases happiness in women, but not in men. We know this is surprising, because the researcher said so — they were expecting a decrease in happiness, and they don’t seem to have been expecting a male:female difference. The researchers say that the difference could be because of testosterone — and of course it could be, but they don’t present any evidence at all that it is.
Anyway, as you will be expecting by now, I found the paper (the Herald gets points for giving the journal name), and it is possible to do a simple test for differences in `happiness’ effect between men and women. And there isn’t much evidence for a difference. For people who collect p-values: about 0.09 (Bayesian would get a similar conclusion after a lot more work). So, if we didn’t expect a benefit in women and no difference in men, the data don’t give us much encouragement for believing that.
Testing for differences isn’t the ideal solution — even better would be to fit a model that allows for a smooth variation between constant effect and separate effect — but testing for differences is a good precursor to putting out a press release about differences and trying for headlines all over the world. We can’t expect newspapers to weed this sort of thing out if scientists are encouraging it via press releases.
Here are the team ratings prior to Round 26, along with the ratings at the start of the season. I have created a brief description of the method I use for predicting rugby games. Go to my Department home page to see this.
| Current Rating | Rating at Season Start | Difference | |
|---|---|---|---|
| Sea Eagles | 5.82 | 9.83 | -4.00 |
| Cowboys | 5.36 | -1.32 | 6.70 |
| Bulldogs | 5.08 | -1.86 | 6.90 |
| Rabbitohs | 4.46 | 0.04 | 4.40 |
| Storm | 3.82 | 4.63 | -0.80 |
| Knights | 1.06 | 0.77 | 0.30 |
| Raiders | -0.02 | -8.40 | 8.40 |
| Sharks | -0.13 | -7.97 | 7.80 |
| Broncos | -0.21 | 5.57 | -5.80 |
| Wests Tigers | -1.19 | 4.52 | -5.70 |
| Titans | -1.81 | -11.80 | 10.00 |
| Dragons | -2.04 | 4.36 | -6.40 |
| Roosters | -3.95 | 0.25 | -4.20 |
| Eels | -6.57 | -4.23 | -2.30 |
| Warriors | -6.65 | 5.28 | -11.90 |
| Panthers | -6.77 | -3.40 | -3.40 |
So far there have been 184 matches played, 108 of which were correctly predicted, a success rate of 58.7%.
Here are the predictions for last week’s games.
| Game | Date | Score | Prediction | Correct | |
|---|---|---|---|---|---|
| 1 | Sea Eagles vs. Broncos | Aug 24 | 16 – 6 | 10.62 | TRUE |
| 2 | Raiders vs. Bulldogs | Aug 24 | 34 – 6 | -6.05 | FALSE |
| 3 | Panthers vs. Titans | Aug 25 | 36 – 22 | -3.21 | FALSE |
| 4 | Dragons vs. Warriors | Aug 25 | 38 – 6 | 4.75 | TRUE |
| 5 | Cowboys vs. Knights | Aug 25 | 22 – 14 | 8.96 | TRUE |
| 6 | Roosters vs. Wests Tigers | Aug 26 | 44 – 20 | -2.51 | FALSE |
| 7 | Rabbitohs vs. Eels | Aug 26 | 38 – 6 | 12.39 | TRUE |
| 8 | Storm vs. Sharks | Aug 27 | 20 – 18 | 9.68 | TRUE |
Here are the predictions for Round 26
| Game | Date | Winner | Prediction | |
|---|---|---|---|---|
| 1 | Knights vs. Rabbitohs | Aug 31 | Knights | 1.10 |
| 2 | Broncos vs. Panthers | Aug 31 | Broncos | 11.10 |
| 3 | Titans vs. Sea Eagles | Sep 01 | Sea Eagles | -3.10 |
| 4 | Wests Tigers vs. Storm | Sep 01 | Storm | -0.50 |
| 5 | Bulldogs vs. Roosters | Sep 01 | Bulldogs | 13.50 |
| 6 | Sharks vs. Cowboys | Sep 02 | Cowboys | -1.00 |
| 7 | Warriors vs. Raiders | Sep 02 | Raiders | -2.10 |
| 8 | Eels vs. Dragons | Sep 02 | Dragons | -0.00 |
Last Wednesday I wrote that a survey should always provoke the questions “How was it done? By whom? and What are they selling?”
This week, Stuff and TVNZ tell us that half of New Zealanders don’t have a will, and that there are more wills in the South Island than the North Island. This survey was commissioned by Public Trust (who do wills), but there’s no information about how the survey was done or by whom. Public Trust don’t currently have any information on their ‘News‘ webpage.
An interesting coincidence, but probably no more: at the moment, the proportion saying they have a will on the clicky poll on the Stuff website is 47%.
Recent comments