August 3, 2012

Air pollution and amnesia

From Sam Judd, in today’s Herald:

In 2009, Auckland had 23 micrograms of PM10 (airborne particles smaller than 10 micrometres) per cubic metre of air as an annual average – 3 above the WHO guidelines of 20. …

The much smaller Hamilton is one behind at 22 (which is our national average), wind doesn’t seem to help Wellington which is at 21 and the notoriously smoggy Christchurch (who has been banning woodfire use periodically since 2010) sits at 20.

Most embarrassingly, despite the fact that their cities are far bigger and more concentrated than ours, Australians enjoy air at 13 PM10 and the bustling metropolis of Syndey sits at only 12.

From the Herald, last September 28

WHO’s air quality guidelines recommend a maximum of 20 micrograms of PM10 per cubic metre of air on average but Auckland with 23, Hamilton on 22 and Wellington on 21 all exceeded that.

but the following day

The data has been replaced by 2010 numbers which showed all New Zealand main centres within the WHO safety guidelines of no more than 20 micrograms of PM10 particles per cubic metre of air with the exception of Dunedin which had been the only compliant New Zealand city according to the previous figures.

The World Health Organisation has removed data from its website that suggested New Zealand cities’ air quality was poorer than any major city in Australia

The actual figures were: 15μg/m3 for Auckland, 13 for Hamilton, 11 for Wellington.    It just doesn’t make sense that traffic-related air pollution would be much higher in Wellington than in Melbourne or Sydney, which are much larger, also choked with traffic, and less windy.   If it sounds too good to be true, it’s probably worth checking.

If you want to worry about actual air pollution in New Zealand, it’s the south-east that’s the place: Timaru is the worst (32 μg/m3), and some Otago towns and cities are also bad.  It’s not primarily traffic that’s the problem, but wood smoke.  Christchurch used to be fairly high, but has improved a lot.
August 2, 2012

Is Lotto rigged?

Stuff seems to think so (via a Stat of the Week nomination)

If you plan to celebrate 25 years of Lotto with a ticket for tonight’s Big Wednesday draw, some outlets offer better odds than others.

No, they don’t.  They offer the same odds, roughly zero. Some outlets have sold more winning tickets than others in the past, that’s all.

Many people, even statisticians, enjoy playing Lotto. If you want to buy tickets at places where other people have won in the past, there’s nothing wrong with that and it won’t hurt your chances.   Since many people enjoy playing, it makes some sense for newspapers to write about Lotto from time to time.  But there’s no excuse for leading with a blatantly untrue statement.


It lives in the cloud

It’s probably a bad sign when Dilbert’s boss has heard of what you do: Big Data

August 1, 2012

NRL Predictions, Round 22

Team Ratings for Round 22

Here are the team ratings prior to Round 22, along with the ratings at the start of the season. I have created a brief description of the method I use for predicting rugby games. Go to my Department home page to see this.

Current Rating Rating at Season Start Difference
Bulldogs 8.16 -1.86 10.00
Rabbitohs 5.37 0.04 5.30
Warriors 3.38 5.28 -1.90
Cowboys 2.95 -1.32 4.30
Sea Eagles 2.56 9.83 -7.30
Storm 2.32 4.63 -2.30
Knights 2.05 0.77 1.30
Broncos 0.63 5.57 -4.90
Titans -0.21 -11.80 11.60
Wests Tigers -1.64 4.52 -6.20
Dragons -2.30 4.36 -6.70
Raiders -4.45 -8.40 3.90
Eels -4.47 -4.23 -0.20
Sharks -4.93 -7.97 3.00
Panthers -6.22 -3.40 -2.80
Roosters -6.96 0.25 -7.20


Performance So Far

So far there have been 152 matches played, 86 of which were correctly predicted, a success rate of 56.58%.

Here are the predictions for last week’s games.

Game Date Score Prediction Correct
1 Dragons vs. Storm Jul 27 26 – 18 -1.66 FALSE
2 Roosters vs. Titans Jul 27 16 – 36 1.14 FALSE
3 Bulldogs vs. Cowboys Jul 28 32 – 18 8.89 TRUE
4 Sea Eagles vs. Warriors Jul 28 24 – 22 -1.36 FALSE
5 Sharks vs. Panthers Jul 28 20 – 21 7.08 FALSE
6 Raiders vs. Knights Jul 29 6 – 36 3.33 FALSE
7 Rabbitohs vs. Wests Tigers Jul 29 32 – 6 8.75 TRUE
8 Broncos vs. Eels Jul 30 22 – 42 15.23 FALSE


Predictions for Round 22

Here are the predictions for Round 22.

Game Date Winner Prediction
1 Roosters vs. Dragons Aug 03 Dragons -0.20
2 Storm vs. Panthers Aug 04 Storm 13.00
3 Knights vs. Bulldogs Aug 04 Bulldogs -1.60
4 Cowboys vs. Sea Eagles Aug 04 Cowboys 4.90
5 Warriors vs. Sharks Aug 05 Warriors 12.80
6 Raiders vs. Broncos Aug 05 Broncos -0.60
7 Titans vs. Rabbitohs Aug 05 Rabbitohs -1.10
8 Wests Tigers vs. Eels Aug 06 Wests Tigers 7.30


Super 15 Predictions, Week 24

Team Ratings for Week 24

Here are the team ratings prior to Week 24, along with the ratings at the start of the season. I have created a brief description of the method I use for predicting rugby games. Go to my Department home page to see this.

Current Rating Rating at Season Start Difference
Crusaders 9.02 10.46 -1.40
Sharks 6.73 0.87 5.90
Stormers 3.74 6.59 -2.90
Chiefs 3.47 -1.17 4.60
Hurricanes 3.40 -1.90 5.30
Bulls 2.93 4.16 -1.20
Reds 0.41 5.03 -4.60
Brumbies -0.89 -6.66 5.80
Blues -2.77 2.87 -5.60
Waratahs -3.13 4.98 -8.10
Highlanders -3.17 -5.69 2.50
Cheetahs -3.99 -1.46 -2.50
Lions -8.75 -10.82 2.10
Force -9.18 -4.95 -4.20
Rebels -11.11 -15.64 4.50


Performance So Far

So far there have been 124 matches played, 87 of which were correctly predicted, a success rate of 70.2%.

Here are the predictions for last week’s games.

Game Date Score Prediction Correct
1 Chiefs vs. Crusaders Jul 27 20 – 17 -1.80 FALSE
2 Stormers vs. Sharks Jul 28 19 – 26 3.10 FALSE


Predictions for Week 24

Here are the predictions for Week 24. The prediction is my estimated points difference with a positive margin being a win to the home team, and a negative margin a win to the away team.

Game Date Winner Prediction
1 Chiefs vs. Sharks Aug 04 Chiefs 1.20


July 31, 2012

Commuter survey ‘can’t be trusted’ – statistician

This just in from National Business Review – thanks to journo Caleb Allison and  NBR Online for giving us permission to upload the content, which sits behind a pay wall.

Commuter survey ‘can’t be trusted’ – statistician 

A statistician questions the validity of a survey promoting flexible working conditions for employees.

A recent survey by Regus – which describes itself as “the world’s largest provider of flexible workspaces” – said 67% of New Zealand employees would spend more time with family if they had a shorter commute as a result of flexible working conditions.

While the survey claimed to have polled more than 16,000 people in 80 countries, NBR ONLINE can reveal the company polled just 54 people in New Zealand.

Auckland University’s Dr Andrew Balemi says while it is a very low number, that alone does not suggest the poll is dodgy.

“Most people obsess about the sample size, but what I obsess about is the sample quality,” Dr Balemi says.

The only way to know if the information is credible is to know how the company undertook the survey.

However, the methodology was not included with the poll.

Dr Balemi says not only does this survey have a small sample size, it doesn’t tell the reader how it was obtained.

“In the absence of any explanation of how they’ve collected the data I wouldn’t trust this information.

“If they can’t even do that, I wouldn’t dignify it with any more consideration.”

He says the company may have a valid methodology and the poll could be worthy, but they should have included that information in the survey.

This follows another recent example of dodgy polling by the Auckland Council.

A press release claiming 63% of Aucklanders favour mayor Len Brown’s city rail loop turned out to have surveyed only 112 people.

July 30, 2012

Stat of the Week Competition: July 28 – August 3 2012

Each week, we would like to invite readers of Stats Chat to submit nominations for our Stat of the Week competition and be in with the chance to win an iTunes voucher.

Here’s how it works:

  • Anyone may add a comment on this post to nominate their Stat of the Week candidate before midday Friday August 3 2012.
  • Statistics can be bad, exemplary or fascinating.
  • The statistic must be in the NZ media during the period of July 28 – August 3 2012 inclusive.
  • Quote the statistic, when and where it was published and tell us why it should be our Stat of the Week.

Next Monday at midday we’ll announce the winner of this week’s Stat of the Week competition, and start a new one.

(more…)

July 29, 2012

Not quite, but thanks for playing

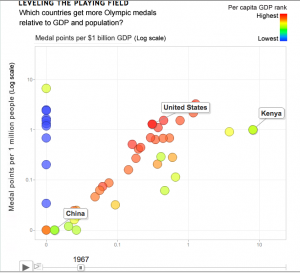
An interesting attempt at data visualization for Olympic medal counts, from US progressive magazine Mother Jones.  Dave Gilson looks to have used Google’s Motion Chart tools, which give the look of the GapMinder animations to your own data.  Unfortunately, it doesn’t quite work.


The first problem (as the article goes on to admit) is that the Olympics happen only every four years, but the animation is continuous — the snapshot above shows the medal counts for 1967, when the Olympics would have been held 3/4 of the way from Tokyo to Mexico City.

There’s also data problems: the vertical line of blue points should correspond to countries that do well on medals per capita, and poorly on medals per $GDP — ie, infinitely rich countries.  They are actually Eastern Bloc countries whose GDP was not available.  The article actually says a GDP of zero was used, but that’s not what the graph shows.

The whole idea of standardizing to total GDP and total population doesn’t really make sense here: GDP and population are roughly proportional for large sets of countries, so you’d expect a strong diagonal tendency in the graph even if wealth wasn’t all that important.   To spread the points out a bit and help disentangle GDP from population, it would be better to use population on one axis and per capita GDP on the other.  Han Rosling, in the original GapMinder animation, uses per capita GDP.

Incidentally, GapMinder also has much more complete data on GDP, which could have improved the medal graph.


July 26, 2012

Cancer deaths rates down (slightly)

The Herald has a story that, I think, satisfies all the best-practice guidelines for scientific news.

They are reporting on new Ministry of Health cancer mortality statistics for 2009, and trends up to that year. In particular

  • The source of the information is described well
  • They quote both total deaths and rates per 100,000 population, and explain why the trends are different.
  • They ask experts for comment and context, and give reasonable explanations of what might be causing the trends

A couple of things I would add to the story:  first, the mortality rates per 100,000 population are also age-adjusted, so they take into account the aging population, and second, an important contributing factor to the reduction in the cancer mortality rate over time is the reduction in smoking.  Improvements in diagnosis and treatment also help, but they are not the whole story, especially for lung cancer.

If you want the actual numbers, they are here.

Good reporting of a poll

The Herald has a fairly good story about a poll on motorway tolls:  the target population (Auckland City), the sample size, the results, and the sampling method are all described.

The sample wasn’t a random sample, but according to the description, it was still a reasonable sample

Those surveyed were drawn from a research panel recruited by Horizon in accordance with the demographics of Auckland’s adult population at the last Census, weighted to match age, gender, personal income, employment and education levels

The respondents will be a biased sample, but the pollers have made efforts to correct this bias.  That’s what is done in good-quality national surveys even if a random sample is taken, because non-response inevitably makes the sample less representative than it should be.

There are two points that would have been welcome in the story which weren’t there.  Firstly, there is no margin of error.  Using a biased sample and reweighting will typically give a larger margin of error than using a random sample, though not so large as to make a big difference to the conclusions the Herald reports.  Secondly, the respondents were asked for their opinions about different ways of raising 10 billion dollars to pay for major city projects, but it’s not clear whether they were asked about just not doing the projects and saving the 10 billion dollars.