July 4, 2012

NRL Predictions, Round 18

Team Ratings for Round 18

Here are the team ratings prior to Round 18, along with the ratings at the start of the season. I have created a brief description of the method I use for predicting rugby games. Go to my Department home page to see this.

Current Rating Rating at Season Start Difference
Storm 9.09 4.63 4.50
Bulldogs 6.13 -1.86 8.00
Sea Eagles 5.70 9.83 -4.10
Broncos 4.04 5.57 -1.50
Warriors 3.49 5.28 -1.80
Rabbitohs 2.33 0.04 2.30
Cowboys 1.96 -1.32 3.30
Wests Tigers 1.59 4.52 -2.90
Sharks 0.18 -7.97 8.20
Titans -2.35 -11.80 9.50
Dragons -2.51 4.36 -6.90
Knights -3.68 0.77 -4.50
Roosters -5.28 0.25 -5.50
Raiders -7.64 -8.40 0.80
Panthers -8.16 -3.40 -4.80
Eels -8.64 -4.23 -4.40


Performance So Far

So far there have been 122 matches played, 72 of which were correctly predicted, a success rate of 59.02%.

Here are the predictions for last week’s games.

Game Date Score Prediction Correct
1 Broncos vs. Sharks Jun 29 12 – 26 12.62 FALSE
2 Eels vs. Knights Jun 30 12 – 20 0.97 FALSE
3 Warriors vs. Cowboys Jul 01 35 – 18 3.93 TRUE
4 Rabbitohs vs. Panthers Jul 01 38 – 12 12.89 TRUE
5 Raiders vs. Dragons Jul 02 22 – 18 -1.51 FALSE


Predictions for Round 18

Here are the predictions for Round 18

Game Date Winner Prediction
1 Wests Tigers vs. Bulldogs Jul 06 Bulldogs -0.00
2 Storm vs. Raiders Jul 07 Storm 21.20
3 Titans vs. Warriors Jul 07 Warriors -1.30
4 Rabbitohs vs. Knights Jul 08 Rabbitohs 10.50
5 Sea Eagles vs. Eels Jul 08 Sea Eagles 18.80
6 Sharks vs. Roosters Jul 09 Sharks 10.00


Super 15 Predictions, Week 20

Team Ratings for Week 20

Here are the team ratings prior to Week 20, along with the ratings at the start of the season. I have created a brief description of the method I use for predicting rugby games. Go to my Department home page to see this.

Current Rating Rating at Season Start Difference
Crusaders 9.42 10.46 -1.00
Stormers 5.80 6.59 -0.80
Bulls 4.85 4.16 0.70
Hurricanes 3.57 -1.90 5.50
Chiefs 3.35 -1.17 4.50
Sharks 2.65 0.87 1.80
Reds 1.14 5.03 -3.90
Brumbies 0.57 -6.66 7.20
Waratahs -2.01 4.98 -7.00
Cheetahs -3.24 -1.46 -1.80
Highlanders -3.41 -5.69 2.30
Blues -5.97 2.87 -8.80
Lions -8.39 -10.82 2.40
Force -8.76 -4.95 -3.80
Rebels -12.88 -15.64 2.80


Performance So Far

So far there have been 106 matches played, 74 of which were correctly predicted, a success rate of 69.8%.

Here are the predictions for last week’s games.

Game Date Score Prediction Correct
1 Highlanders vs. Chiefs Jun 29 21 – 27 -1.50 TRUE
2 Rebels vs. Reds Jun 29 17 – 31 -8.70 TRUE
3 Crusaders vs. Hurricanes Jun 30 22 – 23 12.50 FALSE
4 Force vs. Brumbies Jun 30 17 – 28 -3.70 TRUE
5 Stormers vs. Lions Jun 30 27 – 17 20.30 TRUE
6 Bulls vs. Cheetahs Jun 30 40 – 24 11.90 TRUE


Predictions for Week 20

Here are the predictions for Week 20. The prediction is my estimated points difference with a positive margin being a win to the home team, and a negative margin a win to the away team.

Game Date Winner Prediction
1 Chiefs vs. Crusaders Jul 06 Crusaders -1.60
2 Reds vs. Highlanders Jul 06 Reds 9.10
3 Blues vs. Force Jul 07 Blues 7.30
4 Waratahs vs. Brumbies Jul 07 Waratahs 1.90
5 Cheetahs vs. Stormers Jul 07 Stormers -4.50
6 Lions vs. Rebels Jul 07 Lions 9.00
7 Sharks vs. Bulls Jul 07 Sharks 2.30


July 3, 2012

Minimum pricing for alcohol

John Key is quoted in the Herald as not understanding minimum unit pricing

Mr Key believed that if a minimum price were set, it would change the quality of alcohol that people drank, but not the amount.

“What typically happens is people move down the quality curve and still get access to alcohol.”

The point of minimum unit pricing, as opposed to increased excise rates, is precisely to stop this.  The idea is that there is a minimum retail price for a quantity of alcohol: the proposal here was $1.50 per standard drink, in the law recently passed in Scotland it is 50p, and in the Canadian province of Saskatchewan it is $2.25.  If the price of your currently-preferred adult beverage is raised by the law, everything ‘down the quality curve’ will also have its price raised to exactly the same level.

There are reasons why it might not work: the price elasticity of demand might be low or there might be too much black-market supply. Reasonable people could also believe the benefits aren’t worth the impact on moderate drinkers: eg, at $1.50 per 12g of alcohol most red wines (at 14% alcohol) would have to cost at least $13.50 per bottle.  But, if anything, it would move people up the quality curve, not down.  That’s why it’s different from just raising excise rates.

You can read an analysis of the impact of the Saskatchewan policy, presented to the Scottish Parliament by a Canadian researcher: it seems to have reduced the quantity of alcohol drunk and also led people to drink lower-alcohol beverages.


Finding out if policies work

The UK Cabinet Office (with the help of Ben Goldacre and David Torgerson) has come out in favour of finding out whether new policies actually work:

‘Test, Learn, Adapt‘ is a paper which the Behavioural Insights Team is publishing in collaboration with Ben Goldacre, author of Bad Science, and David Torgerson, Director of the University of York Trials Unit. The paper argues that Randomised Controlled Trials (RCTs), which are now widely used in medicine, international development, and internet-based businesses, should be used much more extensively in public policy.

As we have pointed out before, lots of people come up with potentially good ideas for dietary interventions, crime prevention, reductions in drug use, and improved education, to name just a few targets.     The experience from medical research is that plausible, theoretically-sound, carefully thought-out treatment ideas mostly don’t work.  In other fields we don’t know because we haven’t looked.

July 2, 2012

Stat of the Week Competition: June 30 – July 6 2012

Each week, we would like to invite readers of Stats Chat to submit nominations for our Stat of the Week competition and be in with the chance to win an iTunes voucher.

Here’s how it works:

  • Anyone may add a comment on this post to nominate their Stat of the Week candidate before midday Friday July 6 2012.
  • Statistics can be bad, exemplary or fascinating.
  • The statistic must be in the NZ media during the period of June 30 – July 6 2012 inclusive.
  • Quote the statistic, when and where it was published and tell us why it should be our Stat of the Week.

Next Monday at midday we’ll announce the winner of this week’s Stat of the Week competition, and start a new one.
(more…)

June 30, 2012

Drug statistics

As you will have heard, the UN says that Kiwis smoke more pot than anyone else.  The figure quoted, eg, by the Herald is 9.1%-14.6% (they don’t say what the range means).  It’s useful to look at the actual survey data, the NZ Alcohol and Drug Use survey, which is conveniently available online.

The proportion of New Zealanders who used cannabis at least weekly in the past year is about 5.6%, and the proportion who used it more than 1-2 times/week is 3.8%.  For tobacco, the corresponding figure for more than 1-2 times per week is about 20% and for alcohol, 26%.

You can find statistics broken down by age, sex, ethnicity, frequency of use, and indicators of dependency (yes, people do get addicted to cannabis, just like to other drugs).

June 28, 2012

Open data discussions

The political/social science/etc blog Crooked Timber is having a seminar on Open Data, which is highly recommended.  In one of the posts, Steven Berlin Johnson writes about the mid-19th century efforts of William Farr to publish more information on causes of death, information later used by John Snow in attributing cholera to contaminated water.

He concludes:

Yes, information abundance meant that the newspapers lost their local advertising monopolies to Craigslist and Groupon, but it also means that the crucial data they used to have to unearth by hanging around City Hall for months is now available to anyone with a Web browser or an API key. We may well have fewer investigative journalists on the payroll of newspapers, but if we play our Open Data cards right, we might well end up with more investigations.


[Update: these are now all collected in a post and PDF and epub]

Alpine fault: can we panic now?

The Herald has a good report of research to be published in Science tomorrow, studying earthquakes on the Alpine fault.  By looking at a river site where quakes disrupted water flow, interrupting peat deposition with a layer of sediment, the researchers could get a history of large quakes going back 8000 years. They don’t know exactly how big any of the quakes were, but they were big enough to rupture the surface and affect water flow, so at the least they would mess up roads and bridges, and disrupt tourism.

Based on this 8000-year history, it seems that the Alpine fault is relatively regular in how often it has earthquakes: more so than the San Andreas Fault in California, for example.  Since the fault has major earthquakes about every 330 years, and the most recent one was 295 years ago, it’s likely to go off soon.  Of course, ‘soon’ here doesn’t mean “before the Super 15 final”; the time scales are a bit longer than that.

We can look at some graphs to get a rough idea of the risk over different time scales.  I’m going to roughly approximate the distribution of the times between earthquakes by a log-normal distribution, that is, the logarithm of the times has a Normal distribution.

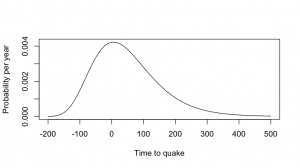
This is a simple and reasonable model for time intervals, and it also has the virtue of giving the same answers that the researchers gave to the press.  Using the estimates of mean and variation in the paper, the distribution of times to the next big quake looks like the first graph.  The quake is relatively predictable, but “relatively” in this sense means “give or take a century”.
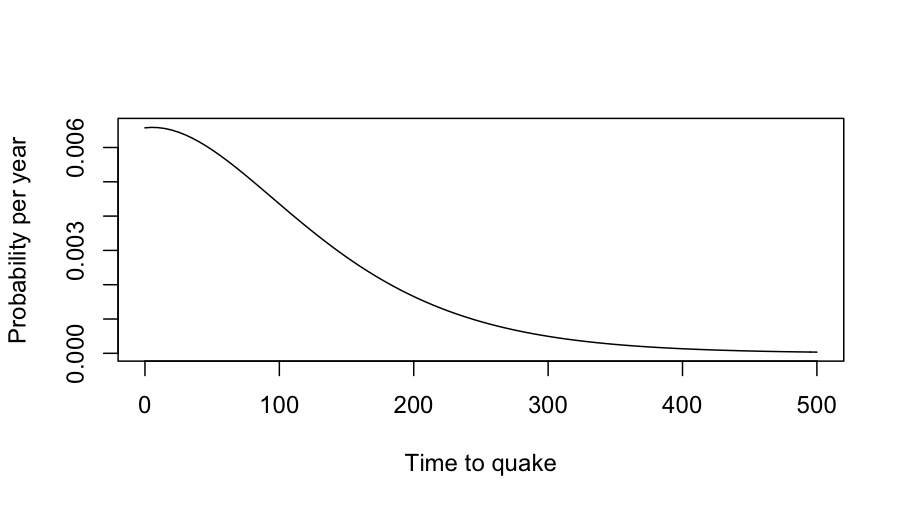
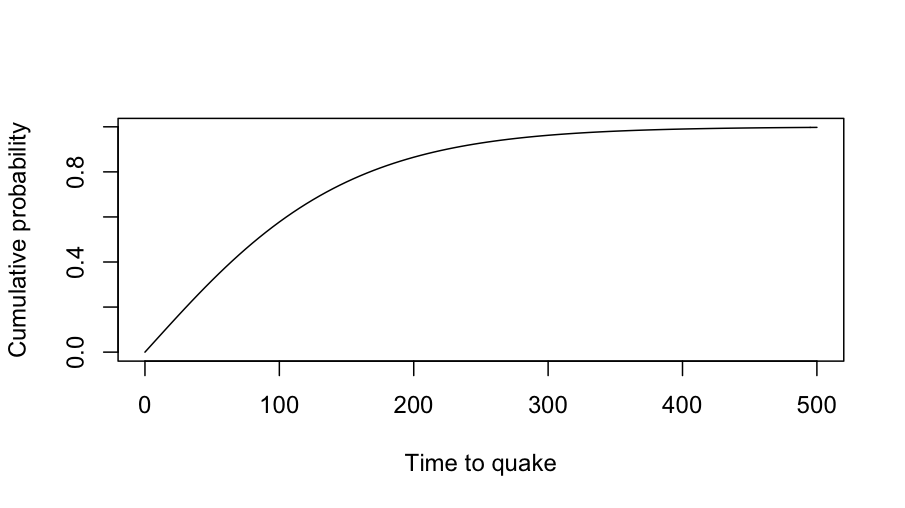
Now, by definition, the next big quake hasn’t happened yet, so we can throw away the part of this distribution that’s less than zero, and rescale the distribution so it still adds up to 1, getting the second graph.  The chance of a big quake is a bit less than 1% per year — not very high, but certainly worth doing something about.  For comparison, it’s about 2-3 times the risk per year of being diagnosed with breast cancer for middle-aged women.

The Herald article (and the press release) quote a 30% chance over 50 years, which matches this lognormal model.  At 80 years there’s a roughly 50:50 chance, and if we wait long enough the quake has to happen eventually.

The risk of a major quake in any given year isn’t all that high, but the problem isn’t going away and the quake is going to make a serious mess when it happens.


[Update: Stuff also has an article. They quote me  (via the Science Media Centre) , but I’m just describing one of the graphs in the paper: Figure 3B, if you want to go and check that I can do simple arithmetic]

NRL Predictions, Round 17

Team Ratings for Round 17

Here are the team ratings prior to Round 17, along with the ratings at the start of the season. I have created a brief description of the method I use for predicting rugby games. Go to my Department home page to see this.

Current Rating Rating at Season Start Difference
Storm 9.09 4.63 4.50
Broncos 6.17 5.57 0.60
Bulldogs 6.13 -1.86 8.00
Sea Eagles 5.70 9.83 -4.10
Cowboys 3.01 -1.32 4.30
Warriors 2.44 5.28 -2.80
Wests Tigers 1.59 4.52 -2.90
Rabbitohs 1.28 0.04 1.20
Sharks -1.95 -7.97 6.00
Dragons -2.07 4.36 -6.40
Titans -2.35 -11.80 9.50
Knights -4.39 0.77 -5.20
Roosters -5.28 0.25 -5.50
Panthers -7.11 -3.40 -3.70
Eels -7.92 -4.23 -3.70
Raiders -8.08 -8.40 0.30


Performance So Far

So far there have been 117 matches played, 70 of which were correctly predicted, a success rate of 59.83%.

Here are the predictions for last week’s games.

Game Date Score Prediction Correct
1 Dragons vs. Titans Jun 22 8 – 6 5.31 TRUE
2 Broncos vs. Rabbitohs Jun 23 26 – 12 8.52 TRUE
3 Cowboys vs. Raiders Jun 23 40 – 18 14.36 TRUE
4 Panthers vs. Eels Jun 23 18 – 19 6.52 FALSE
5 Bulldogs vs. Storm Jun 24 20 – 4 -6.58 FALSE
6 Roosters vs. Sea Eagles Jun 24 14 – 52 -0.47 TRUE
7 Knights vs. Wests Tigers Jun 25 38 – 20 -5.19 FALSE


Predictions for Round 17

Here are the predictions for Round 17

Game Date Winner Prediction
1 Broncos vs. Sharks Jun 29 Broncos 12.60
2 Eels vs. Knights Jun 30 Eels 1.00
3 Warriors vs. Cowboys Jul 01 Warriors 3.90
4 Rabbitohs vs. Panthers Jul 01 Rabbitohs 12.90
5 Raiders vs. Dragons Jul 02 Dragons -1.50


Super 15 Predictions, Week 19

Team Ratings for Week 19

Here are the team ratings prior to Week 19, along with the ratings at the start of the season. I have created a brief description of the method I use for predicting rugby games. Go to my Department home page to see this.

Current Rating Rating at Season Start Difference
Crusaders 10.50 10.46 0.00
Stormers 6.62 6.59 0.00
Bulls 4.53 4.16 0.40
Chiefs 2.99 -1.17 4.20
Sharks 2.65 0.87 1.80
Hurricanes 2.49 -1.90 4.40
Reds 0.72 5.03 -4.30
Brumbies -0.01 -6.66 6.60
Waratahs -2.01 4.98 -7.00
Cheetahs -2.92 -1.46 -1.50
Highlanders -3.06 -5.69 2.60
Blues -5.97 2.87 -8.80
Force -8.17 -4.95 -3.20
Lions -9.21 -10.82 1.60
Rebels -12.45 -15.64 3.20


Performance So Far

So far there have been 100 matches played, 69 of which were correctly predicted, a success rate of 69%.

Here are the predictions for last week’s games.

Game Date Score Prediction Correct
1 Crusaders vs. Highlanders Jun 01 51 – 18 15.20 TRUE
2 Rebels vs. Brumbies Jun 01 19 – 27 -7.90 TRUE
3 Blues vs. Chiefs Jun 02 34 – 41 -4.00 TRUE
4 Waratahs vs. Hurricanes Jun 02 12 – 33 4.00 FALSE
5 Lions vs. Sharks Jun 02 38 – 28 -10.70 FALSE
6 Bulls vs. Stormers Jun 02 14 – 19 3.80 FALSE


Predictions for Week 19

Here are the predictions for Week 19. The prediction is my estimated points difference with a positive margin being a win to the home team, and a negative margin a win to the away team.

Game Date Winner Prediction
1 Highlanders vs. Chiefs Jun 29 Chiefs -1.50
2 Rebels vs. Reds Jun 29 Reds -8.70
3 Crusaders vs. Hurricanes Jun 30 Crusaders 12.50
4 Force vs. Brumbies Jun 30 Brumbies -3.70
5 Stormers vs. Lions Jun 30 Stormers 20.30
6 Bulls vs. Cheetahs Jun 30 Bulls 11.90