May 2, 2012

Super 15 Predictions, Week 11

Team Ratings for Week 11

Here are the team ratings prior to Week 11, along with the ratings at the start of the season. I have created a brief description of the method I use for predicting rugby games. Go to my Department home page to see this.

Current Rating Rating at Season Start Difference
Crusaders 9.36 10.46 -1.10
Stormers 7.60 6.59 1.00
Bulls 7.19 4.16 3.00
Chiefs 4.07 -1.17 5.20
Waratahs 0.77 4.98 -4.20
Sharks -0.03 0.87 -0.90
Reds -1.68 5.03 -6.70
Highlanders -1.95 -5.69 3.70
Hurricanes -2.16 -1.90 -0.30
Brumbies -2.16 -6.66 4.50
Blues -2.23 2.87 -5.10
Cheetahs -2.56 -1.46 -1.10
Force -4.98 -4.95 -0.00
Lions -10.83 -10.82 -0.00
Rebels -13.72 -15.64 1.90


Performance So Far

So far there have been 66 matches played, 45 of which were correctly predicted, a success rate of 68.2%.

Here are the predictions for last week’s games.

Game Date Score Prediction Correct
1 Blues vs. Reds Apr 27 11 – 23 7.00 FALSE
2 Lions vs. Brumbies Apr 27 20 – 34 -2.30 TRUE
3 Chiefs vs. Hurricanes Apr 28 33 – 14 9.20 TRUE
4 Force vs. Stormers Apr 28 3 – 17 -7.00 TRUE
5 Cheetahs vs. Highlanders Apr 28 33 – 36 5.20 FALSE
6 Waratahs vs. Crusaders Apr 29 33 – 37 -4.10 TRUE


Predictions for Week 11

Here are the predictions for Week 11. The prediction is my estimated points difference with a positive margin being a win to the home team, and a negative margin a win to the away team.

Game Date Winner Prediction
1 Hurricanes vs. Blues May 04 Hurricanes 4.60
2 Rebels vs. Bulls May 04 Bulls -16.40
3 Chiefs vs. Lions May 05 Chiefs 19.40
4 Brumbies vs. Waratahs May 05 Brumbies 1.60
5 Sharks vs. Highlanders May 05 Sharks 6.40
6 Cheetahs vs. Force May 05 Cheetahs 6.90
7 Crusaders vs. Reds May 06 Crusaders 15.50


Survey respondents say the darndest things

Stuff is reporting a mind-boggling survey result

Nearly 15 per cent of people worldwide believe the world will end during their lifetime and 10 per cent think the Mayan calendar could signify it will happen in 2012, according to a new poll.

The obvious expectation is that this is a Bogus Poll and that nothing of the sort is true.  However, as the story says, this is a poll conducted for Reuters  by Ipsos, and the findings as given by Ipsos are just as Stuff reports them.

Presumably Ipsos, who know how to poll, are accurately reporting what people said, and the 15% and 10% figures are actually reasonably representative of what people will answer if you ask them that question.  That doesn’t mean the conclusions are true — they obviously aren’t true, since if 15% of people really believed that, they would be behaving differently.

This is a big problem with surveys — even representative polls of people can give weird results, because polls measure how people answer questions, not what they actually believe.

One of my favorite examples is a poll (via) conducted shortly after the massive  Gulf of Mexico oil spill, which found that  “28 percent of Republicans said the recent oil spill in the Gulf of Mexico made them more likely to support drilling off the coast“. This just makes no sense: you could rationally believe that the oil spill is just part of the costs of economic growth and that it doesn’t change your opinion, but supporting drilling more, because of a drilling accident that turned out to be worse and harder to fix than expected, is insane.


Behind-the-scenes look at NY Times graphs and infographics

Thanks to Kottke‘s excellent blog, I’ve just discovered chartsnthings – a reasonably new blog which details the thinking and work behind some of the New York Times graphs and infographics.

Nice to see they use R (originally developed here at the Department of Statistics at The University of Auckland) to create their graphs.

May 1, 2012

We can explain anything

If you have a research finding that is statistically borderline but makes sense biologically, it often seems that the biological explanation should make it more convincing.  Unfortunately, people are really good at explanations and almost any set of flimsy starting materials can be woven together into a superficially firm explanatory facade.  Keith Baggerley, who analyses gene expression data, says that the cancer researchers he works with can always find explanations for a list of genes that are overactive in a particular experiment — and he’s verified this by giving them completely random gene lists.

The Herald has a nice example in an article on functional foods:

You might be surprised to learn that you can often visually identify the function of natural foods. …Walnuts are nicknamed “brain food” and they look just like tiny brains complete with left and right hemispheres.

Sliced tomatoes resemble the structure of the heart with multiple chambers and, you guessed it, are credited with reducing the risk of heart disease. The list goes on – avocados for the uterus, celery for bones. It seems functional foods have always existed if you look closely.

It helps if you are allowed to stretch both the conditions for similarity and for functionality — celery isn’t distinctively good for bones, and the similarity of avocado to the uterus depends enormously on which variety you choose (or perhaps the Reed cultivar, in season now, and the seedless cocktail avocados are supposed to have other functions).     It also helps if you can ignore badly-fitting examples:  a Canadian paper recently had a similarly credulous story about mushrooms as a functional food, but edible mushrooms are of many different shapes, and the common cultivated mushroom shares its shape with things that you really don’t want to eat.

I won’t even comment on what organ the carrot’s shape shows it supposed to benefit.

April 30, 2012

Marti Anderson interview: Statistics and diving

Statistician and marine biologist Marti Anderson from Massey University talked to Kim Hill on Radio New Zealand National about studying complex biological systems of species. The 18 minute long MP3 recording of the interview is now available online here, or listen below:

Marti was a part of the Department of Statistics at the University of Auckland for many years.

Good gambling, bad gambling

The recent Sky City stories illustrate an interesting division in media reports of gambling


Drinking age and suicide?

The Herald says “Lower drinking age blamed for high rate of youth deaths” and quotes a University of Auckland researcher, Dr Anne Beautrais,

“Addressing alcohol use and binge drinking in young people in New Zealand is one of the most obvious avenues to reducing both suicide and traffic mortality.”

Dr Beautrais points out that the high suicide rate in NZ can’t just be attributed to better reporting than in other countries. The overall youth death rate is high in NZ, and while diagnosis of suicide might be variable, diagnosis of death is pretty reliable.   That all makes sense.   Road deaths are an important component, and there you’d expect lowering the drinking age to have some effect.

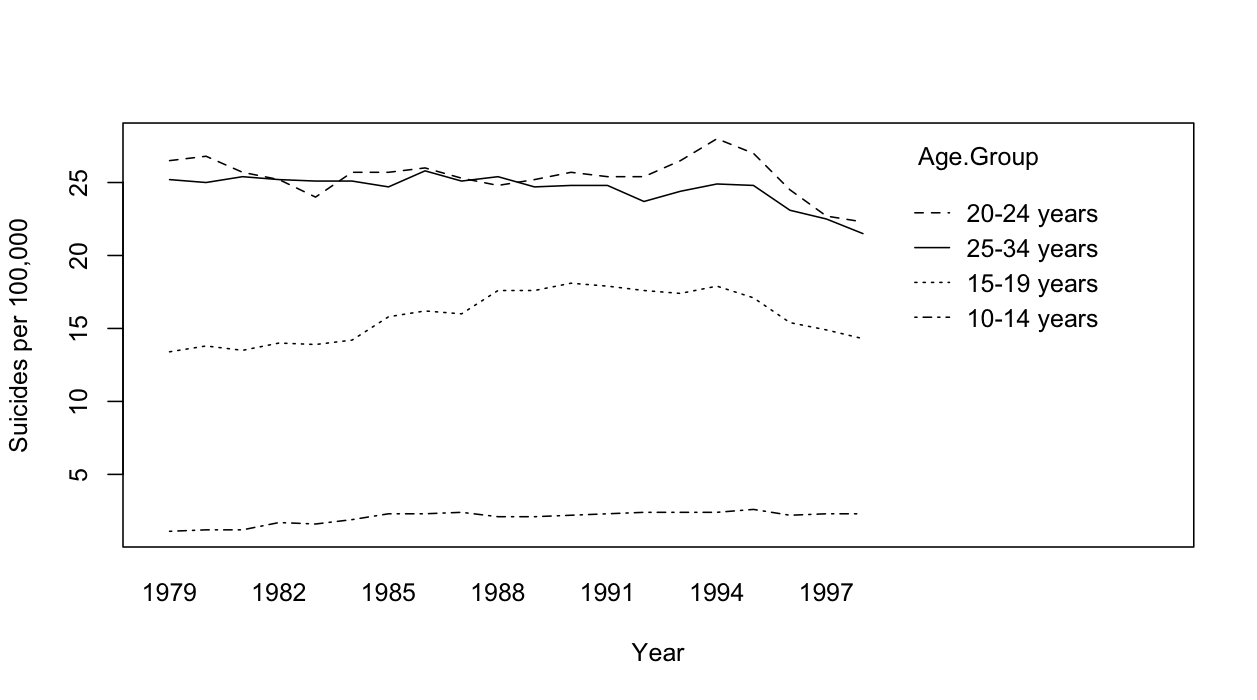
I’m less convinced by the drinking-age argument  for suicide.  One reason is the US experience, where the Reagan administration raised the drinking age to 21 in 1984.  The graph below (data from CDC) shows US male suicide rates by age group across time, and there’s really no sign of a decrease in 1984

Stat of the Week Winner: April 21-27 2012

Due to no entries being posted in last week’s Stat of the Week competition, there is no winner this week. Make sure you add your nominations in for this week’s competition!

Stat of the Week Competition: April 28-May 4 2012

Each week, we would like to invite readers of Stats Chat to submit nominations for our Stat of the Week competition and be in with the chance to win an iTunes voucher.

Here’s how it works:

  • Anyone may add a comment on this post to nominate their Stat of the Week candidate before midday Friday May 4 2012.
  • Statistics can be bad, exemplary or fascinating.
  • The statistic must be in the NZ media during the period of April 28-May 4 2012 inclusive.
  • Quote the statistic, when and where it was published and tell us why it should be our Stat of the Week.

Next Monday at midday we’ll announce the winner of this week’s Stat of the Week competition, and start a new one.


The fine print:

  • Judging will be conducted by the blog moderator in liaison with staff at the Department of Statistics, The University of Auckland.
  • The judges’ decision will be final.
  • The judges can decide not to award a prize if they do not believe a suitable statistic has been posted in the preceeding week.
  • Only the first nomination of any individual example of a statistic used in the NZ media will qualify for the competition.
  • Employees (other than student employees) of the Statistics department at the University of Auckland are not eligible to win.
  • The person posting the winning entry will receive a $20 iTunes voucher.
  • The blog moderator will contact the winner via their notified email address and advise the details of the $20 iTunes voucher to that same email address.
  • The competition will commence Monday 8 August 2011 and continue until cancellation is notified on the blog.
April 29, 2012

2012 Data Journalism Awards Nominees Announced

The first international competition to recognize outstanding work in the growing field of data journalism, the Data Journalism Awards, has just announced the 58 nominees for the 2012 awards.

The competition is being run by the Global Editors Network, supported by Google and in collaboration with the European Journalism Centre.

The University of Auckland’s Jonathan Albright is one of the nominees for his data-driven investigation Did Twitter censor Occupy Wall Street. Congratulations Jonathan!

Winners will be announced on May 31 during the News World Summit in Paris.

See the full list of the fascinating nominees »