April 29, 2012

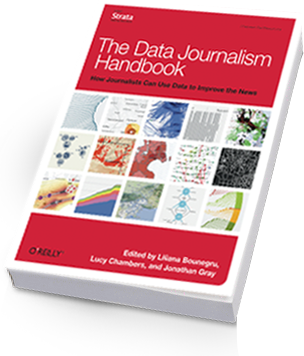
Data Journalism Handbook now available

I’m very excited to learn that the Data Journalism Handbook is now live and I am looking forward to reading it. The handbook features contributions from over 70 leading practitioners of data journalism from every corner of the globe, from Japan to Finland, Nigeria to the US and from leading news outlets such the New York Times, Zeit Online, the BBC and the Guardian.

It’s an open educational resource, under a creative commons licence (CC-BY-SA) so you may share it and remix it. It is hoped that the handbook will encourage many budding data journalists to look at data as a source and give them courage to tackle it, as well as showcasing some great examples of journalism using data as inspiration for future stories.

You can find the handbook at: http://datajournalismhandbook.org/

Also available for pre-order is the e-book and print version from O’Reilly Media: http://oreil.ly/ddj-e-print.

April 28, 2012

Malignant iPhones?

The Herald has a headline “Scientists call for urgency on cancer-phone link”.  The actual content is ok, but the story does give the impression that it’s scientific consensus vs evil cellphone companies, which is not remotely true.  There’s a more balanced story in the Daily Mail (and that’s not a sentence you want to find yourself writing too often).

The facts:  there has been an increase in frontal lobe and temporal lobe brain tumours in the UK over the past decade, though not in total brain tumours.   If you lump together the two regions of the brain with increases and exclude all the ones with  decreases, you get about a 50% increase in rates, which comes to a bit less than one extra case per 100,000 people per year.   For context, that’s a bit less than the estimates of numbers of deaths due to phone use while driving.    There was a Danish study last year that did not find any differences between cell phone users and non-users, or differences in side of the head for users, but that doesn’t quite contradict the British results, for two reasons.  Firstly, there’s quite a bit of uncertainty in both sets of estimates, and they are just about compatible with, say, a 25% increase.  Secondly, the Danish study was mostly of non-malignant tumours, which are the most common ones, and the British statistics are for malignant tumours, so it’s possible the effect could be different, though there’s no known reason that it should be.

The increase could be chance (it’s statistically significant, but still), or an increase in diagnosis, or be due to something else entirely.  Or it could, perhaps, be due to cellphones.  In order to be confident it is cellphones we’d need much better evidence, especially as there isn’t really a convincing story yet of how cellphones could promote tumour growth.

The obvious textbook example of time trends revealing a cancer cause is smoking and lung cancer: smoking took off during World War I and lung cancer rates followed. Except that really isn’t the story.  When Richard Doll and Austin Bradford Hill set out to do their pioneering case-control study of lung cancer in London they were both smokers.  They were expecting the increases in lung cancer to be something to do with the dramatic increase in cars and bitumen roads — perhaps car exhaust, or perhaps some of the pollutants that evaporate off as roads are laid.  The real explanation was enough of a surprise that they were planning to extend the study to four additional cities as confirmation before publishing (until confirmation came instead from a parallel US study).   In that case the relative risk was 20 rather than 1.5, and the absolute lifetime risk increase was about 15% rather than about 0.05%, so it was a lot easier (and much more important) to find the real cause.

 The anti-cellphone scientists argue that it’s worth taking steps to reduce cellphone exposure even though the evidence is pretty weak, and they have a point.  The main step they propose is using a headset, preferably wired.  Lots of people are already doing that — if your phone is also your music player,  then headphones are an obvious necessity even if they don’t provide any protection from brain cancer.
 

April 25, 2012

Super 15 Predictions, Week 10

Team Ratings for Week 10

Here are the team ratings prior to Week 10, along with the ratings at the start of the season. I have created a brief description of the method I use for predicting rugby games. Go to my Department home page to see this.

Current Rating Rating at Season Start Difference
Crusaders 9.37 10.46 -1.10
Bulls 7.19 4.16 3.00
Stormers 7.03 6.59 0.40
Chiefs 3.28 -1.17 4.40
Waratahs 0.76 4.98 -4.20
Sharks -0.03 0.87 -0.90
Blues -0.71 2.87 -3.60
Hurricanes -1.37 -1.90 0.50
Cheetahs -1.90 -1.46 -0.40
Highlanders -2.60 -5.69 3.10
Brumbies -3.09 -6.66 3.60
Reds -3.20 5.03 -8.20
Force -4.42 -4.95 0.50
Lions -9.90 -10.82 0.90
Rebels -13.72 -15.64 1.90


Performance So Far

So far there have been 60 matches played, 41 of which were correctly predicted, a success rate of 68.3%.

Here are the predictions for last week’s games.

Game Date Score Prediction Correct
1 Highlanders vs. Blues Apr 20 30 – 27 2.50 TRUE
2 Reds vs. Stormers Apr 20 13 – 23 -4.90 TRUE
3 Hurricanes vs. Crusaders Apr 21 14 – 42 -2.10 TRUE
4 Waratahs vs. Rebels Apr 21 30 – 21 20.90 TRUE
5 Sharks vs. Chiefs Apr 21 12 – 18 2.60 FALSE
6 Bulls vs. Brumbies Apr 21 36 – 34 17.20 TRUE


Predictions for Week 10

Here are the predictions for Week 10. The prediction is my estimated points difference with a positive margin being a win to the home team, and a negative margin a win to the away team.

Game Date Winner Prediction
1 Blues vs. Reds Apr 27 Blues 7.00
2 Lions vs. Brumbies Apr 27 Brumbies -2.30
3 Chiefs vs. Hurricanes Apr 28 Chiefs 9.20
4 Force vs. Stormers Apr 28 Stormers -7.00
5 Cheetahs vs. Highlanders Apr 28 Cheetahs 5.20
6 Waratahs vs. Crusaders Apr 29 Crusaders -4.10


NRL Predictions, Round 8

Team Ratings for Round 8

Here are the team ratings prior to Round 8, along with the ratings at the start of the season. I have created a brief description of the method I use for predicting rugby games. Go to my Department home page to see this.

Current Rating Rating at Season Start Difference
Storm 9.16 4.63 4.50
Broncos 7.51 5.57 1.90
Sea Eagles 4.37 9.83 -5.50
Dragons 3.54 4.36 -0.80
Wests Tigers 1.99 4.52 -2.50
Warriors 1.73 5.28 -3.50
Cowboys 1.53 -1.32 2.80
Bulldogs 1.51 -1.86 3.40
Knights 1.09 0.77 0.30
Rabbitohs -0.49 0.04 -0.50
Sharks -3.12 -7.97 4.90
Raiders -4.62 -8.40 3.80
Roosters -5.47 0.25 -5.70
Panthers -5.71 -3.40 -2.30
Eels -7.89 -4.23 -3.70
Titans -8.87 -11.80 2.90


Performance So Far

So far there have been 56 matches played, 30 of which were correctly predicted, a success rate of 53.57%.

Here are the predictions for last week’s games.

Game Date Score Prediction Correct
1 Dragons vs. Knights Apr 13 12 – 4 6.76 TRUE
2 Broncos vs. Raiders Apr 13 30 – 6 15.23 TRUE
3 Storm vs. Bulldogs Apr 14 12 – 6 13.32 TRUE
4 Roosters vs. Cowboys Apr 14 12 – 50 4.26 FALSE
5 Sea Eagles vs. Titans Apr 14 14 – 26 23.41 FALSE
6 Warriors vs. Rabbitohs Apr 15 44 – 22 3.82 TRUE
7 Sharks vs. Eels Apr 15 24 – 18 9.90 TRUE
8 Panthers vs. Wests Tigers Apr 15 0 – 30 1.91 FALSE


Predictions for Round 8

Here are the predictions for Round 8

Game Date Winner Prediction
1 Dragons vs. Roosters Apr 25 Dragons 13.50
2 Storm vs. Warriors Apr 25 Storm 11.90
3 Bulldogs vs. Sea Eagles Apr 27 Bulldogs 1.60
4 Broncos vs. Titans Apr 27 Broncos 20.90
5 Rabbitohs vs. Cowboys Apr 28 Rabbitohs 2.50
6 Raiders vs. Sharks Apr 29 Raiders 3.00
7 Eels vs. Wests Tigers Apr 29 Wests Tigers -5.40
8 Knights vs. Panthers Apr 30 Knights 11.30


April 23, 2012

Stat of the Week Competition Winner: April 14-20 2012

Due to no entries being posted in last week’s Stat of the Week competition, there is no winner this week. Make sure you add your nominations in for this week’s competition!

Stat of the Week Competition: April 21-27 2012

Each week, we would like to invite readers of Stats Chat to submit nominations for our Stat of the Week competition and be in with the chance to win an iTunes voucher.

Here’s how it works:

  • Anyone may add a comment on this post to nominate their Stat of the Week candidate before midday Friday April 27 2012.
  • Statistics can be bad, exemplary or fascinating.
  • The statistic must be in the NZ media during the period of April 21-27 2012 inclusive.
  • Quote the statistic, when and where it was published and tell us why it should be our Stat of the Week.

Next Monday at midday we’ll announce the winner of this week’s Stat of the Week competition, and start a new one.


The fine print:

  • Judging will be conducted by the blog moderator in liaison with staff at the Department of Statistics, The University of Auckland.
  • The judges’ decision will be final.
  • The judges can decide not to award a prize if they do not believe a suitable statistic has been posted in the preceeding week.
  • Only the first nomination of any individual example of a statistic used in the NZ media will qualify for the competition.
  • Employees (other than student employees) of the Statistics department at the University of Auckland are not eligible to win.
  • The person posting the winning entry will receive a $20 iTunes voucher.
  • The blog moderator will contact the winner via their notified email address and advise the details of the $20 iTunes voucher to that same email address.
  • The competition will commence Monday 8 August 2011 and continue until cancellation is notified on the blog.
April 22, 2012

Soon they’ll be blogging

According to the Herald, “Baboons learn to tell real words from gibberish”, which would put them ahead of some politicians and academics.   The story describes

… new research that shows baboons are able to pick up the first step in reading – identifying recurring patterns and determining which four-letter combinations are words and which are gobbledygook.

Here’s the press release,  and the scientific paper. After being trained with a bunch of real and made-up words with four letters (no, not the ones you’re thinking of), the baboons could classify new four-letter combinations with about 75% accuracy, compared to 50% for pure chance.

The scientists were a bit more restrained, saying that the baboons were probably looking at which two-letter pairs appeared more frequently in the real words.   In fact, as Mark Liberman describes at Language Log, it was probably even simpler than that.    If the baboons just recognised the shapes of  individual letters, that would be enough for them to get 75% accuracy.  If they were really doing anything more sophisticated they should be doing much, much better than 75% accuracy.

One thing I don’t understand, though, is why French psychologists would try to teach the baboons to recognise English words.

Does that medication really work?

How do we know whether a particular drug, therapy or operation really works, and how well? How reliable is the evidence? Are clinical trials truly unbiased?

Recommended for their plain-language approach to answering these questions are  Testing Treatments: Better research for better healthcare by three doctors and a health advocate, and the University of Sydney’s Smart Choices: Making sense of health advice.

And even better, both are free downloads.

April 20, 2012

It might be a bit more complicated than that

The Herald has a very good story about a breast-cancer genomics project, where researchers looked at mutations in 2000 stored breast-cancer tumour samples, and used these to pigeonhole the tumours into 10 groups.  The hope is that this information can be used, eventually, to work out which tumours respond to which treatments, resulting in more effective treatment with fewer side-effects.

The researchers are properly careful about the implications

“I want to be very cautious here. This is a very important first step, and now what follows is to validate its clinical use,” Caldas said.

 In particular, there have been at least two papers recently that perform whole-genome sequencing on multiple samples from the same tumour (via “In the Pipeline”).  These researchers found surprising levels of heterogeneity within single tumours — different regions appeared to have developed different sequences of mutations more-or-less independently. Cancer seems to get more complicated whenever we look closer.
April 19, 2012

Super 15 Predictions, Week 9

Team Ratings for Week 9

Here are the team ratings prior to Week 9, along with the ratings at the start of the season. I have created a brief description of the method I use for predicting rugby games. Go to my Department home page to see this.


Current Rating Rating at Season Start Difference
Bulls 8.41 4.16 4.20
Crusaders 7.30 10.46 -3.20
Stormers 6.63 6.59 0.00
Chiefs 2.60 -1.17 3.80
Waratahs 1.72 4.98 -3.30
Hurricanes 0.70 -1.90 2.60
Sharks 0.65 0.87 -0.20
Blues -0.67 2.87 -3.50
Cheetahs -1.90 -1.46 -0.40
Highlanders -2.64 -5.69 3.00
Reds -2.79 5.03 -7.80
Brumbies -4.31 -6.66 2.30
Force -4.42 -4.95 0.50
Lions -9.90 -10.82 0.90
Rebels -14.68 -15.64 1.00


Performance So Far

So far there have been 54 matches played, 36 of which were correctly predicted, a success rate of 66.7%.

Here are the predictions for last week’s games.

Game Date Score Prediction Correct
1 Blues vs. Sharks Apr 13 23 – 29 4.90 FALSE
2 Force vs. Waratahs Apr 13 18 – 23 -1.00 TRUE
3 Crusaders vs. Stormers Apr 14 31 – 24 4.80 TRUE
4 Brumbies vs. Rebels Apr 14 37 – 6 11.80 TRUE
5 Cheetahs vs. Chiefs Apr 14 33 – 39 1.10 FALSE
6 Lions vs. Bulls Apr 14 18 – 32 -13.80 TRUE


Predictions for Week 9

Here are the predictions for Week 9. The prediction is my estimated points difference with a positive margin being a win to the home team, and a negative margin a win to the away team.

Game Date Winner Prediction
1 Highlanders vs. Blues Apr 20 Highlanders 2.50
2 Reds vs. Stormers Apr 20 Stormers -4.90
3 Hurricanes vs. Crusaders Apr 21 Crusaders -2.10
4 Waratahs vs. Rebels Apr 21 Waratahs 20.90
5 Sharks vs. Chiefs Apr 21 Sharks 2.60
6 Bulls vs. Brumbies Apr 21 Bulls 17.20