Posts filed under Graphics (394)

February 2, 2018

Map whining

I’ve seen this map several times on Twitter. It’s originally from a British company, ThirtyFifty. It gives a really nice idea of where the world’s wine regions are, and why, in terms of temperature.

There’s one problem, which is probably more obvious to New Zealanders than northern-hemisphere people. The latitude lines are wrong.

The 50N line and the equator are right, but the 30N line is a little too far north; the 30S line is a little too far north; and the 50S line is way too far north — it’s at about 45S, measured by the southern tip of Tasmania and the middle of NZ’s South Island.

January 18, 2018

Maps and models

This spectacular map from the National Geospatial-Intelligence Agency was circulating yesterday on Twitter. I got it from Christopher Jackson (@seis_matters). It shows antineutrino emissions from around the earth

Our local (sub)continent of Zealandia shows up nicely at the bottom right. The black dots are nuclear reactors, and the dark smudge is just the immense rock mass of the Himalayas.

This next map is a style you’ve seen before. It shows New Zealand’s winds at the moment: the storm is passing over.

What these maps have in common is a very high ratio of model to actual data.  The `live’ wind map isn’t based on detailed live reports from a fine grid of weather stations. There aren’t any — especially out in the Pacific. It’s a map of the NOAA Global Forecast System, but forecasting the very near future rather than the long range. It isn’t going to give you more up-to-date information than the Met Service.

The antineutrino map is even more model-based. In the scientific paper I was struck by the sentence

Recently, the blossoming field of neutrino geoscience, first proposed by Eder15, has become a reality with 130 observed geoneutrino interactions12,13 confirming Kobayashi’s view of the Earth being a “neutrino star”16

It looks like the map has well over a million pixels per observed geophysical neutrino. When it comes to nuclear reactors, the paper says “These exciting geophysical capabilities have significant overlap with the non-proliferation community where remote monitoring of antineutrinos emanating from nuclear reactors is being seriously considered“. That is, the reactors are black dots on the map because they know where the reactors are and how many neutrinos they’d make, not because they measured them. The observations do go into the model, and they probably provide actual information about the deeper bits of the earth’s crust, but the map is of the model, not the observaations.

Better or worse?

There was some controversy about the difficulty of the NCEA level 1 maths and stats exam last year.  As Stuff reports

It prompted the NZQA to release the exam to the public, and now the authority is taking the extra step to share the exam outcome before the consolidated results are released in April.

“NZQA has taken the unusual step of announcing these provisional results early so we can respond to the concerns teachers raised with us in the open letter,” said NZQA deputy chief executive Kristine Kilkelly.

“Provisional results for the NCEA Level 1 Mathematics and Statistics examinations in November show the majority of students who sat the examinations gained an Achieved or better grade for each standard.”

There’s a graph with the story, which is always nice:

I’m not convinced this graph is a great way of showing how the 2017 results differed from previous years: it’s better for showing that, yes, the majority of people passed.

Here’s my attempt at showing the 2017 differences: the arrows show the change from last year and the bars show the five-year range. I think it would have been better to just plot the four six-year time series, but that data wasn’t in the NCEA press release. It would also have been better to look at the ‘Merit’ and ‘Excellence’ percentages, but again that’s not given.

I think it’s clearer from this graph that the pass rate for “91028  Investigate Relationships Between Tables, Equations and Graphs” was lower last year, and lower by quite a large amount relative to previous the year-to-year variation. Two of the units have no sign of that sort of drop, and the fourth has a similar drop but from a high point to a value still within the recent range.

So, maybe there was an issue with the ‘tables, equations and graphs’ test.


Update: another redesign by Andrew P. Wheeler

January 9, 2018

Election maps: what’s the question?

XKCD has come out with a new map of the 2016 US election

In about 2008 I made a less-artistic one of the 2004 elections on similar principles

These maps show some useful things about the US vote:

  1. the proportions for the two parties are pretty close, but
  2. most of the land area has very few voters, and
  3. most areas are relatively polarised
  4. but not as polarised as you think, eg, look at the cities in Texas

What these maps are terrible at is showing changes from one election to the next. The map for 2004 (Republicans ahead by about 2.5%) and 2016 (Republicans behind by about 3%) look very similar. And even 2008 (Republicans behind by 7%) wouldn’t look that different.

Like a well-written thousand words, a well-drawn picture needs to be about something. Questions matter. The data don’t speak for themselves.

December 15, 2017

Jenny Bryan: “You need a huge tolerance for ambiguity”

Jenny Bryan @JennyBryan was one of several leading women in data science who attended this week’s joint conference of the New Zealand Statistical Association, the International Association of Statistical Computing (Asian Regional Section) and the Operations Research Society of New Zealand at the University of Auckland, 
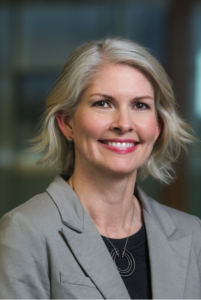
so we couldn’t miss the opportunity to talk with her (Jenny’s conference presentation, titled “Zen and the aRt of workflow maintenance”, is here). A brief bio: Jenny is a software engineer at RStudio while on leave from her role as Associate Professor in Statistics at the University of British Columbia, where she was a biostatistician. Jenny serves in leadership positions with rOpenSci and Forwards and is a member of The R Foundation. She takes special delight in eliminating the small agonies of data analysis.

Statschat: When did you first encounter statistics as a young person? Jenny: I was an economics major which had exactly one required statistics paper, which I took, and then continued to try and make that degree as un-quantitative as I possibly could. I had started out thinking I would major in some form of engineering, and therefore was taking math and physics and the technical track.

I was one of very few women in the course, and the culture of the course was to pull an all-nighter once a week [to do the weekly problem set]. The average mark on the exam would be 20 out of 100, and I was mentally not prepared for this type of sort of stamina-driven culture.

Was it a macho culture? That’s how it felt to me, and you needed enough innate confidence to never worry about the fact that you were getting marks you had never seen before in your life – everyone failed miserably all the time. After the first semester or two of this, I decided it wasn’t for me and declared my major to be German literature, which I saw through. But in the last two years at university, I realised I needed to be employable when I graduated, so I added economics as a means to making sure I could make a living later.

I worked as a management consultant for a couple of years and that’s where I learned that I was actually at my happiest when they locked in a room by myself with a huge spreadsheet and I had some data task ahead of me … and so then I gradually worked my way back to what I think I’m really good at.  

Did you pursue statistics qualifications? I did. After my two years of management consulting, the normal track would be to be sent off to business school. But thanks to what I learned about myself, I was pretty sure that wasn’t the right track for me. But I had learned how to give talks, how to extract questions from people and go and make it quantitative and then translate my solution back into their language. So the management consulting experience was super-useful.

At that point, I had met my husband, and I followed him to his first postdoc with no particular plans. He’s a mathematician – he knew he wanted to be a mathematician when he was 6. I never had that kind of certainty about what I was meant to do! It took me a lot longer to figure it out.

So I followed him, and basically played a lot of tennis at first (laughs) while were living in Southern California … I decided some form of statistics would be ideal for me, but I didn’t have enough of a math background to take the specialised math exams in the US, called the GREs [Graduate Record Examinations] that a lot of statistics departments want to see. So I started taking as many prerequisites as I could at the university where he was doing his postdoc. I did well and started working as a teaching assistant in these classes as well.

Then we moved together, two years later, for him to start his second postdoc and for me to start biostatistics grad school. Also during this time, I supported myself doing fancy Excel work as a temp … so I did a PhD in Biostatistics at Berkeley in five years – the first two years are the masters, and three years of writing the thesis.

What’s your academic career path been since then? I got my job at University of British Columbia before I graduated, and I was there until I went on leave earlier this year. I’ve since been working in Hadley Wickham’s group at RStudio. My title is software engineer, which I still find a bit peculiar.

Why? Because I feel I should have more formal training in engineering to have that title, but I’m getting more comfortable with it.

What’s the essence of your role there? I spend about two-thirds of my effort on package development and package maintenance. Hadley is starting to gradually give maintainership of his packages to other people … so I took over readxl. I already had an existing line of work in making R talk to Google APIs [application programming interface], so I worked with an intern this summer and we created a package from scratch so that you can use Google Drive from R. Now I’m revisiting some general tools for authenticating with Google APIs, and I have another package that talks to Google spreadsheets. I also do quite a bit of talking and teaching.

You put a lot of your work on the internet. Why do you feel that is important to share it this way? I decided this was how I was going to interpret what it meant to be a scholar. Several years ago, I decided that teaching people about the process of data analysis was super-important to me, and was being completely undertaught, and I was going to dedicate a lot of my time to it. Luckily, I already had tenure at that point, but it still looks a bit like career suicide to make this decision, because it means that you’re not producing conventional statistical outputs like methodological papers. I also felt like putting my stuff out there and having a public course webpage and pushing things out would be my defence against [any suggestion] that I wasn’t doing anything.

You’re clearly not satisfied that the current academic system is serving the subject well. Not at all! We have a really outdated notion that only publications matter, and publications where there’s novel methodology. I think that’s leaving a ton of value on the table – making sure that statistical methods that exist are actually used, or used correctly. But the field is not set up to reward that – the majority of papers are not widely read and cited, and many of these methods are not used or implemented in any practical way …. it’s been enshrined that academic papers are what counts, but they’re not a directly consumable good by society. We need knowledge-translation activity as well.

So you’re rebelling. Well, I felt that the only way you could do it was to start doing the things you thought were valuable. Being able to put your course material online, to have a dialogue with people in your field on Twitter … you can finally remove a lot of these gatekeepers from your life. They can keep doing their thing, but I know people care and read this stuff. Since I was able to wait until I had security of employment, I decided that if that meant I didn’t go from associate to full [professor], I could live with that. It’s not that my department isn’t [supportive] – it’s either neutral or positive on all this. But it’s true that everyone else I was hired with is a full professor and I’m not.

Does that bug you? Yes and no. I think I could have pushed harder. But every time you push on these things, you’re basically asked, “Well, can you make what you do look more like a statistics publication? Each package that you write, can you write a stats paper around it?” and I’ve decided the answer is, “No. Can we agree that is not a helpful way to evaluate this work? The only reason to repackage it in that way is to check some box.”

Academics are becoming increasingly dissatisfied with academic publishing structures. Do you think that perhaps data scientists might take the lead in dismantling structures that aren’t helping the subject? Maybe, and I think things are changing. But I decided that it’s like turning the Titanic and it’s not going to happen on a time-scale consistent with my career.  I can’t wait for academia to gradually reshape itself.

Is that one of the reasons you went off to RStudio? Oh, absolutely. I feel the things I do are tolerated in academia, and often found very useful, [but that said], I lost my grant funding the more applied I became. It’s harder to get promoted. You’re pressured to sell your work as something it’s not, just because that’s what the status quo rewards. Working at RStudio, I’m actually allowed to say what I do is what I do, and be proud of it, and be told that you are excellent at it, which is not currently possible in academic statistics.

So tell me about your typical day, working for RStudio. It’s a remote company. There is an office in Boston and a large enough group in Seattle that they rent a space, but the rest of us are on our own. So it’s just me alone at home working on my projects. We use Slack as a communication channel; the team I’m on maintains two channels for two separate groups of packages. We might have a group conversation going and it can be completely silent for three days, or we can have 100 messages in a morning. It really depends when someone raises an issue that other people care about, or can help out with. And then, I have private one-off conversations with Hadley or other members of the group, and similarly, they can be very quiet or suddenly light up.

Who do you live with? My husband’s a professor, so he’s mostly on campus but sometimes he’s around – we both like working at home and being alone together. The kids are all at home; they go to school from 9am until 3pm or 4pm. My oldest is 14 and I have twins who are about to turn 12.

So how do you manage work-life balance, given that you work from home? Well, I work when they are not there, then I try to work from 3pm to 6pm, or 4pm to 6pm, with mixed success, I would say. Then there are a couple of hours which are explicitly about driving people here and there. I do a second shift from 9pm to 1am or 2am.

Are you a night owl? Yeah, which I don’t love, but that’s just how things are in my life right now. I have to do it that way. I have one productive shift while the children are at school, then one productive shift after they go to bed.

Let’s talk about women in data science. I have the impression that maths remains male-dominated and that statistics is less so, but that data science appeals to women and that the numbers are quite good. What’s your take on that?  The reason I liked statistics, and particularly liked applied statistics, is I was never drawn to math for maths’ sake, or the inherent beauty of math. I enjoyed doing it in the service of some other thing that I care about … I think it’s possible that there’s something about me that’s typical of other women, where having that external motivation is what makes you interested in, or willing to do, the math and the programming. For its own sake, it never really appealed to me that much. Programming appeals to me more on its own than math does. Programming actually can motivate me just because I love the orderliness of it and accomplishing these little concrete tasks – I love checking lists (laughs) and being able to check my work and know that it is correct … When you combine it with, “This is going to enable us to answer some question”, then it’s really irresistible.

So it’s the real-world nature of it that is really appealing to you. Yeah – I care about that a lot.

What skills and attributes make a good data scientist? I think being naturally curious, doing something for the sake of answering the question versus a “will-this-be-in-the-test?” mentality – just trying to do the minimum.

You need a huge tolerance for ambiguity. This is a quality I notice that we’re spending a lot of time on in our Master of Data Science programme at UBC. Half the students have worked before and about half are straight out of undergrad, and the questions they ask us are so different. The people straight out of undergrad school expect everything to be precisely formulated, and the people who’ve worked get it, that you’re never going to understand every last thing; you’re never going to be given totally explicit instructions. Figuring out what you should be doing is part of your job. So the sooner you develop this tolerance for ambiguity [the better] – that makes you very successful, instead of waiting around to be given an incredibly precise set of instructions. Part of your job is to make that set of instructions.

How much room for creativity is there in data science?  I think there’s a ton. There’s almost never one right answer – there’s a large set of reasonable answers that reasonable people would agree are useful ways of looking at it. I think there’s huge scope to be creative. I also think being organised and pleased by order frequently makes this job more satisfying. People come to you with messy questions and messy data, and part of what you’re doing is this sort of data therapy, helping them organise their thoughts: “What is your actual question? Can the data you have actually answer that question? What’s the closest we can get?” Do that, then package it nicely, you do feel like you’ve reduced entropy! It feels really good.

You work from home and that suits you, but not every woman is able to do that.  What needs to change to help women scientists’ progress through life and career, balancing what they need to balance? I don’t how specific this is to data science, but three things were helpful to me. One is I live in Canada, where we have serious maternity leave – you can take up to a year, and because that’s what the Government makes possible, that means it’s normal. In both cases, I took between six and nine months – I was begging to come back before a year! But having a humane amount of time for maternity leave is important.

Also, what’s typical in Canada, and what and UBC does, is that they pause any sort of career clock for a reasonable amount of time. So every time I went on maternity leave it added one year to my tenure clock.

You don’t end up out of synch with people who hadn’t been away. Yeah. It [parenthood] still slows your career down, but this helps immensely. So there are the structural policies.

Secondly, I do have a really supportive spouse. I feel like maybe I was lead parent when the kids were little, but since I made this career pivot and became much more interested in my work, he’s really taken the lead. I feel that there were many years where I was the primary parent organising the household, and now it’s really the other way around … that’s huge.

Third, I’m in my mid-late 40s now and I’m embarking on what feels to me like a second career; certainly, a second distinct part of my career and focusing more on software development. I think you also have to be willing to accept that women’s careers might unfold on a different time-scale. You might lose a few years in your 30s to having little kids … but you often find awards that are for people within five years of their PhD or for young investigators and they assume that you don’t have all this other stuff going on. I think another thing is [employers] being willing to realise that someone can still be effective, or haven’t reached their peak, in their 40s. The time-frame on which all of this happens needs to be adjusted. You need to be flexible about that.

Read more about Jenny Bryan:

Her academic page

A profile by rOpenSci.org

Di Cook: “I had advantages early on, and I feel like I need to pay that back”

Australian Di Cook @visnut was one of several leading women in data science who attended this week’s joint conference of the New Zealand Statistical Association, the International Association oDi Cookf Statistical Computing (Asian Regional Section) and the Operations Research Society of New Zealand at the University of Auckland, so we couldn’t miss the opportunity to talk with her. A brief bio: Di is a world leader in data visu­al­isa­tion and well-known for her work on inter­ac­tive graph­ics. She is Professor of Business Analytics in the Department of Econometrics and Business Statistics at Monash University. She’s a Fellow of the American Statistical Association, elected member of the R Foundation and the Editor of the Journal of Computational and Graphical Statistics. Her research lies in data science, data visualisation, exploratory data analysis, data mining, high-dimensional methods and statistical computing.

Statschat: When did you first encounter statistics? Di: It was in my undergraduate degree. I studied mathematics with a plan to do math teaching. Statistics was one of the areas of mathematics that I could major in other than pure, or applied, mathematics. There was an extremely good female professor at the University of New England, Eve Bofinger, and I was drawn to some of the methods she was teaching, and that led me into statistics.

What was your career path after that?  I taught math at high school for about three months, then I had an offer from the Australian National University to go there as a research assistant, and that seemed a better fit. As a research assistant, I got to learn a lot more things, particularly computing. Computing, I think, is a critical aspect of data science today.

I spent a few years doing that and then realised I’d really like to make art, because some of the research-assistant work I was doing was computer graphics for data online. It fed into my art instincts from teenage years, so I spent some time as an artist before finding a graduate programme in statistics in the US that focused on data visualisation.

What sort of art do you do? I was painting – I haven’t done any for a long, long time, since I finished my PhD; it’s been too busy.

So your creative pursuits have fed into your career. Yeah – seeing that I could do data visualisation as a part of the statistics allowed me to realise that I could do a higher degree in stats; that merged my interests very well.

Where did you do your PhD? At Rutgers University in New Jersey.

You spent 22 years at Iowa State University in the US, and moved to Monash in Australia in 2015. What are your major projects there? I have a lot of projects. One of them is with Tennis Australia; we’ve been looking at tennis serves. So we have Hawk-Eye trajectory data and we visualise the tennis serves and look at how the players are different or similar.

That’s very cool – how’s that for applied statistics. Yeah, it’s fantastic, isn’t it. We’re also looking at face recognition in tennis video, to be able to detect the face through broadcast video, so that we can monitor emotions throughout a match and see how that affects performance.

We’re also looking at pedestrian sensor data, that comes from a city of Melbourne (almost live) feed. One of my PhD students, Earo, has a new type of plot called a calendar plot; you make your data plots into a calendar format so that you can study things relative to holidays, and put it really on a human pattern basis.

Describe a typical day at work at Monash. We have a lot of meetings with students, so I would meet up with two or three students – PhD students or postdocs or research assistants – on projects that we’re working with, and meet up with other faculty. On some days I’m teaching data science classes to around 200 students. We often just go for a coffee with colleagues. We also play ping-pong on the conference table! I’ve got a good group of colleagues who play tennis, so we play tennis together.

It sounds very collegial. You’re a prominent woman in data science, and the field seems to appeal to women as a career path. Do have any thoughts on that? I haven’t really looked at those numbers … but honestly, I think there’s too big of an emphasis on gender differences, and they’re not real when you look at the metrics. It’s just a perception. But one of the things I notice with the women that I work with is that they are interested in solving problems, and having an outcome of their work that makes life better for others. And that’s one thing that data science offers that pure statistics research is a bit removed from.

Do you have a family? I have one son. I moved to Monash after he graduated high school. He went off to college in the US, while I moved halfway across the globe, which he was quite happy about. He visits during the holidays, and last American summer found an internship at Monash University.

When he was small, how did you navigate work and life? It’s really difficult. I can’t imagine how single women do that – you need to have some sort of support mechanism. Day-care is amazing – and however much you spend on day-care, it’s worth it. And also partly because I think young kids early on really get a huge amount of benefit from being in the social mix of other kids the same age. He was in day-care from three months, part-time, and even at five months, if we were away for a week, when he’d get back, the other babies were over the moon – they recognised each other. I hadn’t realised how early on that socialisation happens.

So you weren’t concerned about day-care at all. Some women get tied up in knots about putting their kids in day-care. I know – there’s this thing about guilt. It is actually the best environment – they [pre-school educators] can do a much better job than me. If my time pressure is relieved by not having to have every moment dealing with all the stuff you have to deal with young kids … he’s come out as being a very sociable child and that he learnt from early on. Guaranteed when you’ve got the most important meeting, and your husband has a most important meeting at exactly the same time, that’ll be the time your kid gets sick. So you have to have a backup.

So what advice do you give other academic mums? Don’t stress – there are ways around. And the meeting you think is most important doesn’t have to be the most important. You just juggle everything you have as well as you can, and there are ways around any hurdle or hiccup. Just keep out there. It’s really important for other younger women to see women in senior roles.

Are universities doing the necessary to help women make the most of their talents in data science? I think it’s still a struggle. I think there’s been bureaucratic pushes for gender equality, which is really how I actually got an academic position in the first place in the US.

How so? Equal opportunity. Many statistics departments had no women, and it was a cultural shift in the early 1990s that many university administrations were forcing departments to hire women … or otherwise they couldn’t hire … if they [universities] were doing it well, they were not putting women in that situation of thinking, “Oh I was only hired because I was a woman”. They were doing it in the sense of making sure that women realised that they were talented, and wanted for their  talents, not just because of the administration push. But that wasn’t universal.

I thought things have been solved, but it’s not. Time and time again women are evaluated differently at promotion, and in classroom evaluations, they are not on average [rated to be] as good as the men, and that’s been shown again and again and again. So the thing is, don’t get put off by that; you will sometimes need to fight for your promotions and have people willing to fight for you.

Systemically, things are still not weighted fairly between men and women. It’s not. I’ve just finished studying some of the research-grant rates in Australia and the number given to women faculty are pitiful, from both the Australian Research Council and the National Health and Medical Research Council, which is the health sciences. That impacts whether women can get through to those higher ranks. That’s my next fight.

Would you see yourself as a crusader? How do you define yourself in exposing these inequalities? We’ve seen a lot of things [around sex, privilege and power discussed] in public in these last few months, with the sex scandals in Hollywood.  I’ve seen that all through my career in academia. I think we, hopefully, are on a cusp where the playing field for recognising talent among women becomes more level … I had advantages early on, and I feel like I need to pay that back.

I wouldn’t say I’m a crusader; I’m saying I see where we’ve come from, in terms of generations of women in my family, and where we are now, and we’ve come a long, long way. I’ve had so many more opportunities than my mum and my grandmother … I feel like I’ve got a responsibility to those generations to keep it moving in the right direction.

What advice would you give young women looking at a career in data science? What skills and attributes do they need to develop? Get onto the publicly available software – free software like R and Python – and get to know them. These are hugely powerful, and they give you power. There’s a number of courses you can do for free to help learn how to work with data.

Any particular courses that you would recommend? There’s Data Camp and Corsera and Software Carpentry, among others. Work with data. Play. Extract somebody’s tweets and analyse the text – there are really good resources for that. Pull data from the government web pages – they have lots of information. The New Zealand Herald has lots of data available. Just get comfortable finding data, making plots of it, and seeing whether it matches up what the media is reporting about a problem. This is the sort of power you can get over your life if you can make decisions yourself, rather than being fed decisions.

Read more about Di Cook:

Her academic page

Wikipedia

Another Q & A

November 15, 2017

Summarising house prices

From the Herald (linking to this story)

pricefall

To begin with, “worst” is distinctly unfortunate now we’ve finally got a degree of political consensus that Auckland house prices are too high. “Best” might be too much to hope for, but at least we could have a neutral term.

More importantly, as the story later concedes, it’s more complicated than that.

It’s not easy to decide what summary of housing prices is ideal.  This isn’t just about mean vs median and the influence of the priciest 1%, though that comes into it.  A bigger problem is that houses are all individuals.  Although the houses sold this October are, by and large, not the same houses that were sold last October, the standard median house price summary compares the median price of one set of houses to the median price of the other set.

When the market is stable, there’s no real problem. The houses sold this year will be pretty much the same as those sold last year. But when the market is stable, there aren’t interesting stories about real-estate prices.  When the market is changing, the mix of houses being compared  can change. In this case, that change is the whole story.

In Auckland as a whole, the median price fell 3.2%. In the old Auckland City — the isthmus — the median price fell 17%. But

Home owners shouldn’t panic though. That doesn’t mean the average house price has fallen by anything like that much.

The fall in median has been driven largely by an increasing number of apartments coming onto the market in the past year.

That is, the comparison of this October’s homes to last October’s homes is inappropriate — they aren’t similar sets of properties.  This year’s mix has many more apartments; apartments are less expensive; so this year’s mix of homes has a lower median price.

The story does admit to the problem with the headline, but it doesn’t really do anything to fix it.  A useful step would be to separate prices for apartments and houses (and maybe also for townhouses if they can be defined usefully) and say something about the price trends for each.   A graph would be a great way to do this.

Separating out changes in the mix of homes on sale from general house price inflation or deflation is also helpful in policy debates. Changing the mix of housing allows us to lower the price of housing by more than we lower the value of existing houses, and would be valuable for the Auckland public to get a good feeling for the difference.

November 4, 2017

Types of weather uncertainty

From the MetService rain radar
rain

If the band of rain were moving north-east, small uncertainties in its motion and orientation would mean that you’d know there would be half an hour of rain in Auckland, but not exactly when.

If it were moving south-east (as it is), small uncertainties in the motion and orientation mean that you know it will rain for a long time somewhere, but not exactly where.

One way to communicate the difference between these two predictions would be to show a set of possible realisations of rainfall.  For NW movement, you’d get a set of curves each with a single hump but at different times. For SW movement you’d get a much wider range of curves, where some showed no rain and others showed half a day or all day. I don’t know enough about ensemble forecasting to be sure, but I think this would be feasible

In principle, the common ‘patchy torrential downpours’ Spring rain pattern would show as rain curves each with different short periods of rain. I don’t think the technology is up to that using genuine predictions, but it might be possible to predict that we’re going to get that sort of weather and simulate the ensemble curves.

Current forecast summaries are mostly (except for hurricane paths) about averages: the probability of rain,  the expected amount, the worst-case amount. As technology progresses we will increasingly be able to do better than averages.


October 31, 2017

Creativity and chartjunk

The StatsNZ twitter account has been tweeting creatively decorated graphs.  The first one I noticed was
cars
which prompted a discussion on Twitter about why the graph actually still worked well even though you’d normally want to avoid this sort of thing.

Then, a few days ago, I saw this one via Harkanwal Singh
bikes
Unlike the cars, which worked as labels, the motorbikes don’t do anything except provide a distraction. They’re a bit better at a smaller size, where they reinforce the local trends in the graph, but I still don’t think they’re a net positive
bike-small

Then today (again via Harkanwal)
pumpkins

Yes, ok, I get that it’s a joke. But pumpkins prices rise  at this time of year in New Zealand because it’s Spring. Halloween isn’t a big driver. And most of our pumpkins aren’t even orange (which is why Stuff has a story on alternative things to carve). And winter isn’t a single point in time. And the decoration distracts from the potentially-important observation that prices didn’t really drop last winter.  And the vertical axis doesn’t say what the units are (average retail price per kilogram, it turns out).

And… just no.

Figure.NZ has the version you want if you’re after information.

October 10, 2017

Graphic of the week

From the world’s third-largest news agency:

afp

  1. The Nationalist Party?
  2. National got 56 seats, not 58 — the graph seems to have the National results from the provisional count but the Labour and Green results from the final count
  3. NZ First doesn’t use yellow
  4. ACT, on the other hand, does.
  5. But ACT is relatively unlikely to enter a left-wing coalition with Labour and the Greens