Posts filed under General (3152)

August 14, 2018

Mitre 10 Cup Predictions for Round 1

Team Ratings for Round 1

The basic method is described on my Department home page.

Here are the team ratings prior to this week’s games, along with the ratings at the start of the season.

Current Rating Rating at Season Start Difference
Canterbury 15.32 15.32 0.00
Wellington 12.18 12.18 0.00
Taranaki 6.58 6.58 0.00
North Harbour 6.42 6.42 0.00
Tasman 2.62 2.62 0.00
Counties Manukau 1.84 1.84 0.00
Otago 0.33 0.33 0.00
Bay of Plenty 0.27 0.27 0.00
Auckland -0.50 -0.50 0.00
Waikato -3.24 -3.24 0.00
Northland -3.45 -3.45 0.00
Manawatu -4.36 -4.36 0.00
Hawke’s Bay -13.00 -13.00 0.00
Southland -23.17 -23.17 0.00


Predictions for Round 1

Here are the predictions for Round 1. The prediction is my estimated expected points difference with a positive margin being a win to the home team, and a negative margin a win to the away team.

Game Date Winner Prediction
1 North Harbour vs. Northland Aug 16 North Harbour 13.90
2 Tasman vs. Canterbury Aug 17 Canterbury -8.70
3 Manawatu vs. Waikato Aug 18 Manawatu 2.90
4 Auckland vs. Counties Manukau Aug 18 Auckland 1.70
5 Bay of Plenty vs. Taranaki Aug 18 Taranaki -2.30
6 Wellington vs. Otago Aug 19 Wellington 15.80
7 Southland vs. Hawke’s Bay Aug 19 Hawke’s Bay -6.20


August 13, 2018

Briefly

Smartphone blues

Q: Did you see that smartphones make you go blind?

A: Doesn’t it depend on what you do while you’re using them?

Q: No, the headline says Blue light from phone screens accelerates blindness, study finds.  And it goes on Light from digital devices triggers creation of toxic molecule in the retina that can cause macular degeneration

A: Yeah nah

Q: They didn’t study phone screens?

A: No

Q: Macular degeneration?

A: No

Q: Retinas?

A: Not as such, no.

Q: Ok, so was it mice? It’s always mice, isn’t it.

A: No, this was cells grown in a lab from standard cell lines then genetically engineered to produce the chemicals the eye uses to see blue light. Some of them were originally derived from mouse cells, and some were originally derived human cells — like the famous HeLa cell line.

Q:

A: You were going to mention that Thor movie, weren’t you?

Q: No, I’ve read The Immortal Life of Henrietta Lacks. Everyone should. But we nearly digress. If they didn’t use digital screens, what did they use? Sharks with lasers on their heads?

A: Close. No sharks. LED lasers.

Q: So why does this show phones make you go blind?

A: That isn’t what they were trying to do. They already believed blue light caused macular degeneration, and they were trying to find out how that works, on a molecular level. It’s clearer from their press release, though that still talks a lot about phones — the newspaper didn’t make this one up.

Q: Is it in the original research paper?

A: No, that’s written in High Biochemist. It’s got subheadings likeBLE-retinal induced PIP2 distortion is independent of GPCR-G protein activation

Q: How do phones even compare as a source of blue light, compared to other sources? Police car lights? University-themed webpages? The sky?

A: Even though your eyes squinch up in bright sunlight, the sun and the sky are going to be the big contributor

Q: Especially if your phone and computer switch to a tasteful sepia colour scheme at night, like they tend to nowadays.

A: So, maybe sunglasses.

August 8, 2018

Briefly

  • From the NY Times Upshot blog: a randomised trial finds little or no effect of providing a workplace wellness program — but within the trial, the people who ended up using the program were healthier. It would have looked effective without randomisation
  • The US National Academy of Science joins the groups saying it’s a bad idea to add a last-minute citizenship question to the US census.
  • “Raising the Bar” is a set of 20 talks in bar by Auckland academics, held on Tuesday 28th August. Some of them are sold out already, but the remaining ones include Andrew Chen on  privacy implications of modern  surveillance systems and Cather Simpson on useful and fun things she does with lasers.
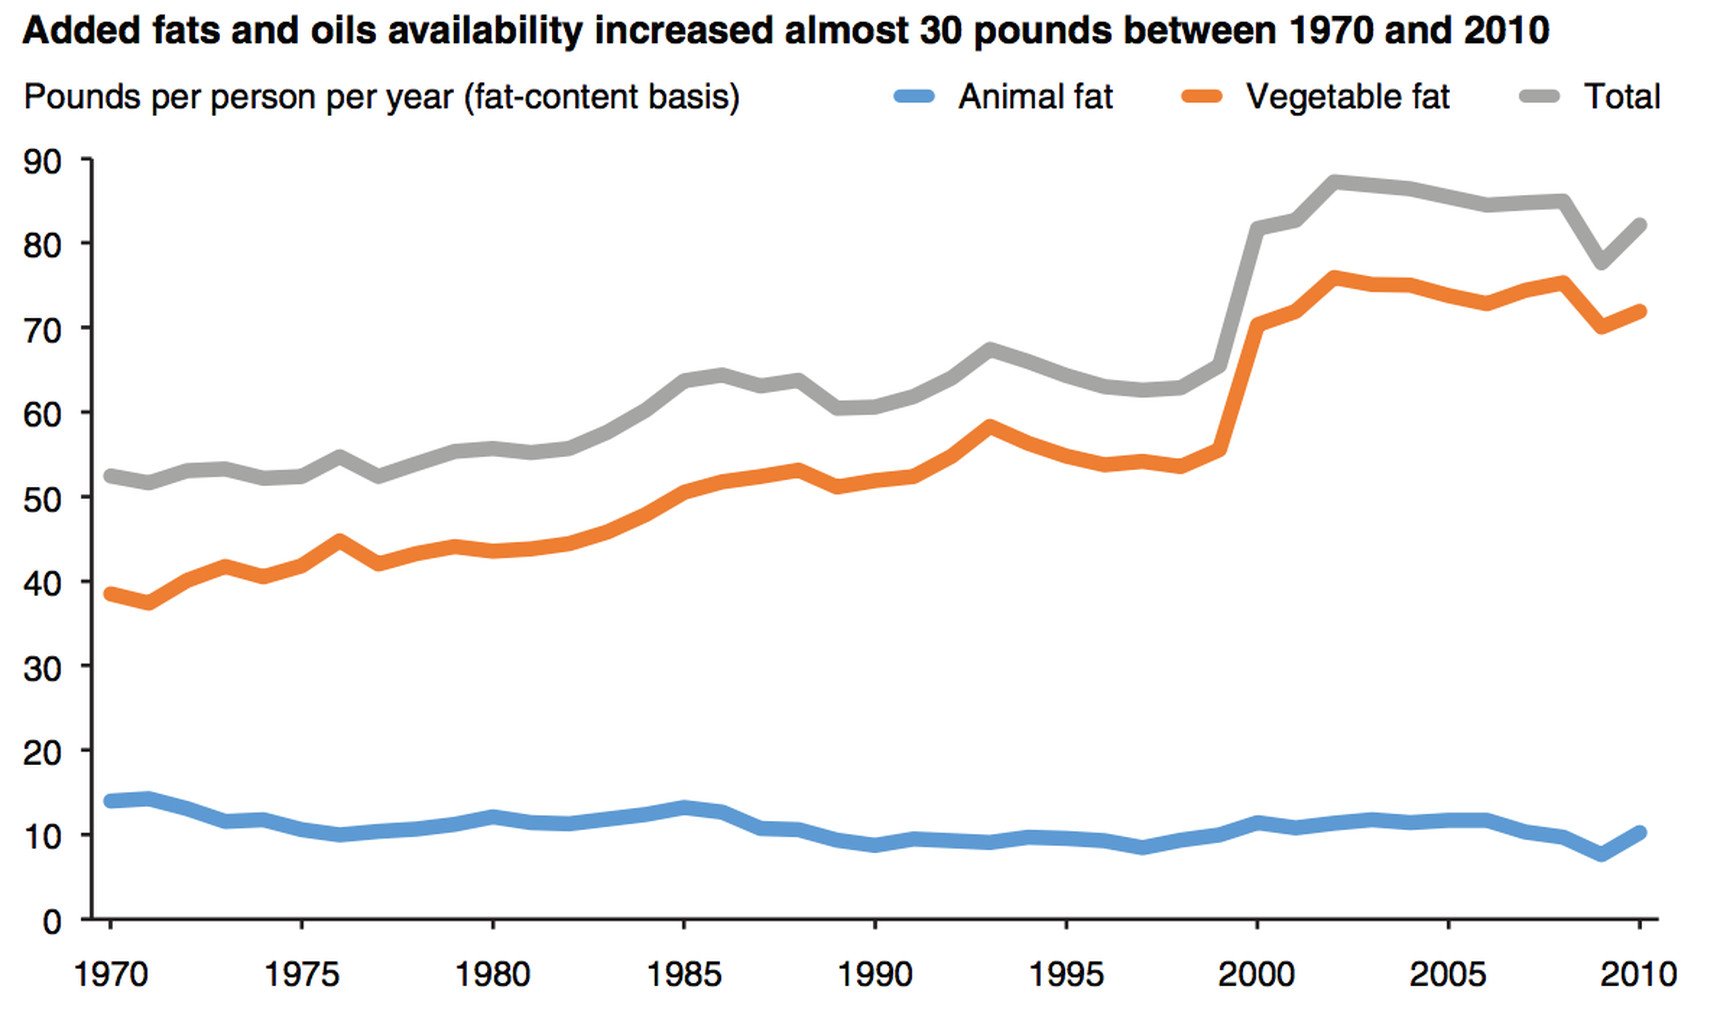
  • This graph appeared at vox.com,
    As Kieran Healy tweeted “that 1-year, ~15lb-per-person jump in vegetable fat consumption c. 2000 is weird, and a candidate for the rule of thumb that sudden jumps in a time series are often due to changes in measurement criteria”.  And so it was.  Official statistics agencies try not to change their definitions without a good reason, and put this sort of thing in footnotes. Which you need to check.


Who counts?

From ABC News (the West Island one, not the US one): Australia’s population hit 25 million, newest resident likely to be young, female and Chinese

There’s a problem with this headline. Well, more than one.  First, the story actually says that about 60% of Australia’s population increase is currently from net migration and about 40% from ‘natural increase’, and that 15.8% of immigrants were from China. So, maybe 10% of the population increase is Chinese immigration, and less than 10% are young, female, Chinese immigrants.  The newest resident is definitely more likely to be a new baby than a young, female, Chinese immigrant.

More importantly, though, if you want to say something about the 25th millionth Aussie, it’s not net migration and natural increase you want, but gross migration and births. The Australian Bureau of Statistics press release says “one birth every 1 minute and 42 seconds…one person arriving to live in Australia every 1 minute and 1 second”. So, while 60% of the increase in population is immigration, there’s only about a 40% chance that the first person over the 25-million threshold was an immigrant. Which actually gives a similar ratio —  just 1.5 percentage points off — but it’s the right calculation.

And while I appreciate “natural increase” is a technical term in demography, I can’t help feeling it’s an unfortunate phrase in communicating statistics to the public.

August 7, 2018

NRL Predictions for Round 22

Team Ratings for Round 22

The basic method is described on my Department home page.
Here are the team ratings prior to this week’s games, along with the ratings at the start of the season.

Current Rating Rating at Season Start Difference
Storm 10.30 16.73 -6.40
Roosters 6.07 0.13 5.90
Rabbitohs 4.02 -3.90 7.90
Sharks 3.05 2.20 0.80
Broncos 1.84 4.78 -2.90
Raiders 1.60 3.50 -1.90
Panthers 1.31 2.64 -1.30
Dragons 0.93 -0.45 1.40
Warriors -1.72 -6.97 5.30
Bulldogs -2.27 -3.43 1.20
Wests Tigers -2.71 -3.63 0.90
Cowboys -2.84 2.97 -5.80
Eels -3.96 1.51 -5.50
Sea Eagles -4.01 -1.07 -2.90
Titans -5.59 -8.91 3.30
Knights -8.34 -8.43 0.10

Performance So Far

So far there have been 160 matches played, 99 of which were correctly predicted, a success rate of 61.9%.
Here are the predictions for last week’s games.


Game Date Score Prediction Correct
1 Bulldogs vs. Broncos Aug 02 36 – 22 -3.60 FALSE
2 Knights vs. Wests Tigers Aug 03 16 – 25 -1.60 TRUE
3 Rabbitohs vs. Storm Aug 03 30 – 20 -5.40 FALSE
4 Dragons vs. Warriors Aug 04 12 – 18 9.30 FALSE
5 Eels vs. Titans Aug 04 28 – 12 2.80 TRUE
6 Roosters vs. Cowboys Aug 04 26 – 20 12.90 TRUE
7 Sharks vs. Sea Eagles Aug 05 32 – 33 11.90 FALSE
8 Panthers vs. Raiders Aug 05 40 – 31 1.70 TRUE


Predictions for Round 22

Here are the predictions for Round 22. The prediction is my estimated expected points difference with a positive margin being a win to the home team, and a negative margin a win to the away team.

Game Date Winner Prediction
1 Cowboys vs. Broncos Aug 08 Broncos -1.70
2 Warriors vs. Knights Aug 10 Warriors 11.10
3 Rabbitohs vs. Roosters Aug 10 Rabbitohs 0.90
4 Titans vs. Panthers Aug 11 Panthers -3.90
5 Sea Eagles vs. Bulldogs Aug 11 Sea Eagles 1.30
6 Eels vs. Dragons Aug 11 Dragons -1.90
7 Raiders vs. Wests Tigers Aug 12 Raiders 7.30
8 Storm vs. Sharks Aug 12 Storm 10.30


July 31, 2018

Super 15 Predictions for the Super Rugby Final

Team Ratings for the Super Rugby Final

The basic method is described on my Department home page.
Here are the team ratings prior to this week’s games, along with the ratings at the start of the season.

Current Rating Rating at Season Start Difference
Crusaders 18.10 15.23 2.90
Hurricanes 10.29 16.18 -5.90
Lions 9.23 13.81 -4.60
Chiefs 9.12 9.29 -0.20
Highlanders 4.58 10.29 -5.70
Waratahs 1.88 -3.92 5.80
Sharks 0.58 1.02 -0.40
Brumbies -0.06 1.75 -1.80
Jaguares -0.22 -4.64 4.40
Stormers -0.33 1.48 -1.80
Blues -3.20 -0.24 -3.00
Bulls -3.81 -4.79 1.00
Rebels -7.97 -14.96 7.00
Reds -8.63 -9.47 0.80
Sunwolves -16.98 -18.42 1.40


Performance So Far

So far there have been 126 matches played, 90 of which were correctly predicted, a success rate of 71.4%.
Here are the predictions for last week’s games.

Game Date Score Prediction Correct
1 Crusaders vs. Hurricanes Jul 28 30 – 12 10.40 TRUE
2 Lions vs. Waratahs Jul 29 44 – 26 10.40 TRUE


Predictions for the Super Rugby Final

Here are the predictions for the Super Rugby Final. The prediction is my estimated expected points difference with a positive margin being a win to the home team, and a negative margin a win to the away team.

Game Date Winner Prediction
1 Crusaders vs. Lions Aug 04 Crusaders 12.90


NRL Predictions for Round 21

Team Ratings for Round 21

The basic method is described on my Department home page.
Here are the team ratings prior to this week’s games, along with the ratings at the start of the season.

Current Rating Rating at Season Start Difference
Storm 11.39 16.73 -5.30
Roosters 6.55 0.13 6.40
Sharks 3.95 2.20 1.70
Broncos 3.07 4.78 -1.70
Rabbitohs 2.94 -3.90 6.80
Raiders 2.11 3.50 -1.40
Dragons 2.00 -0.45 2.40
Panthers 0.80 2.64 -1.80
Warriors -2.79 -6.97 4.20
Wests Tigers -3.23 -3.63 0.40
Cowboys -3.32 2.97 -6.30
Bulldogs -3.50 -3.43 -0.10
Titans -4.66 -8.91 4.30
Eels -4.88 1.51 -6.40
Sea Eagles -4.91 -1.07 -3.80
Knights -7.82 -8.43 0.60


Performance So Far

So far there have been 152 matches played, 95 of which were correctly predicted, a success rate of 62.5%.
Here are the predictions for last week’s games.

Game Date Score Prediction Correct
1 Broncos vs. Sharks Jul 26 12 – 10 2.10 TRUE
2 Cowboys vs. Knights Jul 27 20 – 18 8.40 TRUE
3 Bulldogs vs. Wests Tigers Jul 27 16 – 4 1.20 TRUE
4 Sea Eagles vs. Panthers Jul 28 24 – 28 -2.50 TRUE
5 Rabbitohs vs. Eels Jul 28 26 – 20 11.60 TRUE
6 Storm vs. Raiders Jul 28 44 – 10 8.70 TRUE
7 Titans vs. Warriors Jul 29 36 – 12 -0.80 FALSE
8 Roosters vs. Dragons Jul 29 36 – 18 5.80 TRUE


Predictions for Round 21

Here are the predictions for Round 21. The prediction is my estimated expected points difference with a positive margin being a win to the home team, and a negative margin a win to the away team.

Game Date Winner Prediction
1 Bulldogs vs. Broncos Aug 02 Broncos -3.60
2 Knights vs. Wests Tigers Aug 03 Wests Tigers -1.60
3 Rabbitohs vs. Storm Aug 03 Storm -5.40
4 Dragons vs. Warriors Aug 04 Dragons 9.30
5 Eels vs. Titans Aug 04 Eels 2.80
6 Roosters vs. Cowboys Aug 04 Roosters 12.90
7 Sharks vs. Sea Eagles Aug 05 Sharks 11.90
8 Panthers vs. Raiders Aug 05 Panthers 1.70


July 30, 2018

Low-tech polling?

The President of the United States:

Abraham Lincoln and his policies, as you may remember if you’ve read any US history, were not universally popular with his contemporaries. He won the Electoral College in 1860 without a majority of the popular vote. He did win the 1864 election, but it helped that quite a lot of states where he wasn’t popular weren’t involved in the election, being on the other side of a war at the time.

There wasn’t any modern presidential polling at the time: the first serious attempts were by the Literary Digest early in the twentieth century. They got four in a row correct, then famously predicted that Landon would defeat Roosevelt.  Polling was hard: you couldn’t do it by dialling random telephone numbers because telephone numbers not been invented.  In fact, the advantages of random sampling weren’t widely appreciated back then: when the Literary Digest tried to predict election results they did it by taking as large a sample as possible, rather than a representative one.


Maps and votes

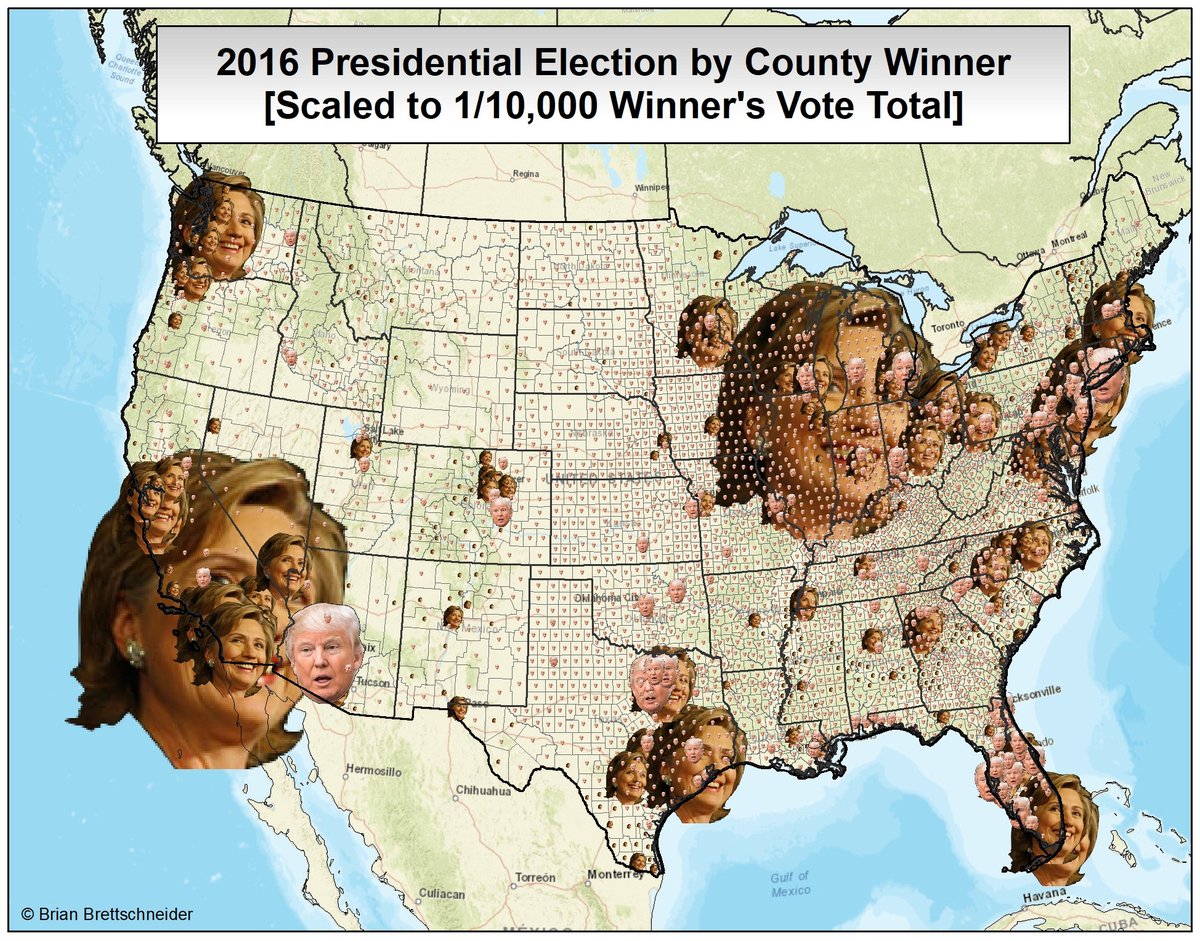
I’ve written several times about the ‘one-cow-one-vote’ problem in election maps, where low-population rural areas dominate the map. Brian Brettschneider has managed to come up with a map distorted the other way

Because the counties with the greatest number of votes are urban, the photos of Hillary Clinton tend to be larger — even in Texas. You also see that in symbol-based maps, too — eg, coloured circles for each county. What makes this map biased is that the small faces are much harder to recognise than larger ones, so that most of Donald Trump’s votes are represented by illegible symbols.  It’s a beautiful opposite of the usual map problems.