Posts filed under General (3160)

February 12, 2012

Cycling deaths

The New Zealand Medical Journal has this month published a review of cycling deaths in New Zealand, with the key finding being that “the helmet law has failed in aspects of promoting cycling, safety, health, accident compensation, environmental issues and civil liberties”. This is a bold claim which should be held to high scrutiny.

The journal article (accessible only by subscription, which we at the University of Auckland are fortunate enough to have) is available at the journal’s website, but for those without subscription access can only be to the media reports of it such as on Stuff.

The article itself is jam-packed full of statistics from various sources, so please bear with me.

The most important is probably Table 1, which shows that whereas pedestrian hours have remained relatively constant from 1989 to 2009, cycling hour have decreased by half, and Table 2, which shows that both pedestrian AND cyclist deaths have decreased from 1989 to 2009. Whereas both have gone down by half, the ratio has remained constant at about one quarter. However these statistics are then ‘corrected’ for the number of hours walked or cycled.

Given that cycling hours have significantly decreased by about 50%, as have the number of cycling deaths by 50% over the same period, the stark result is that cycling deaths per hour cycled have remained about constant over the study period – and certainly not evidence that the introduction of the helmet law, or any other event, has increased the accident rate. Something else is going on with pedestrian deaths altogether, which have encouragingly decreased substantially per walking hour over 1989-2009.

However, the author places emphasis on a new statistic – the ratio of cycling to pedestrian deaths. Whereas pedestrian deaths per hour have markedly gone down, cyclist deaths per hour have not. The ratio of the two means that cycling deaths have apparently increased (but importantly, only relative to pedestrian deaths).

The pedestrian deaths trend is actually a red herring, as we could well compare cycling deaths to any number of trends. According to Statistics New Zealand crime has also gone down since 1994. We could equally posit that the number of cycling deaths relative to crimes has increased, but would this be an alarming statistic? (are the criminals using bicycles as getaway vehicles?).

The article is also loaded with other fascinating statistical statements such as “that life years gained by cycling outweighed life years lost in accidents by 20 times”, which I will not cover the moral implications of here, but is that supposed to be some solace?

The key result from this study seems to in fact be that the rate of accidents for pedestrians has declined significantly over the period of the review, which has to be good news, especially prior to correction for population growth. That cycling hours have halved may well reflect increased awareness of the dangers of cycling in New Zealand.

Regardless of that main finding, the article commits one of the deadly sins of statistics, implying causation from correlation. That the helmet law was introduced in 1994 is about as relevant as TV2 beginning 24 hour programming, or the Winebox enquiry, both in that same year. We could compare trends before and after but with no experimental relationship between the process and the pattern, as tantalising as a relationship between bike helmet laws and accidents might be, it is only a correlation.
More on telly viewing statistics ….

Media 7 last week featured our very own mistress of stats, Rachel Cunliffe, discussing why you can’t take a monthly cumulative audience and divide by four to get the weekly cumulative audience.

Media 7 host Russell Brown, in his latest Public Address column, looks at how a distinctly dodgy ‘statistic’ that came out of former broadcasting minister Jonathan Coleman’s office to justify Cabinet’s decision not to renew TVNZ 7’s funding was perpetuated through the media …   a must-read.

February 9, 2012

Stats Chat on Radio New Zealand National this morning

A warm welcome to everyone who has come by via Radio New Zealand National after Gavin Ellis talked about Stats Chat on the Nine to Noon show this morning.

Gavin Ellis said it’s something “every journalist and member of the public should look at… it really is worthwhile”. Thanks Gavin!

He mentioned these posts:

February 7, 2012

Inequality graph

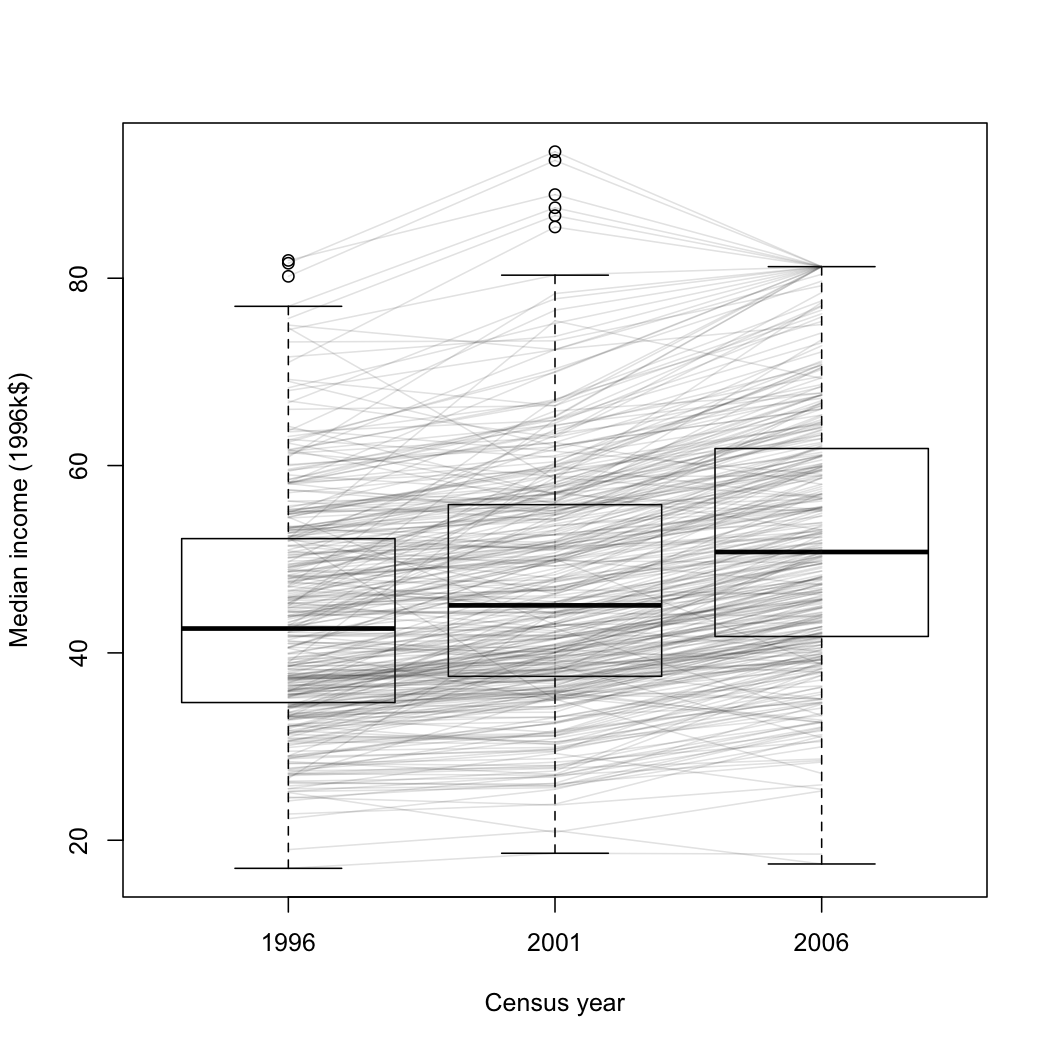
I think this graph is an improvement over the density plot from StatsNZ I showed earlier.  It’s a box plot of median income for all census meshblocks in the Auckland region, in 1996, 2001, and 2006 (except for the ones that were too small to have data released publically). The data are from Stats New Zealand, rescaled to 1996 dollars

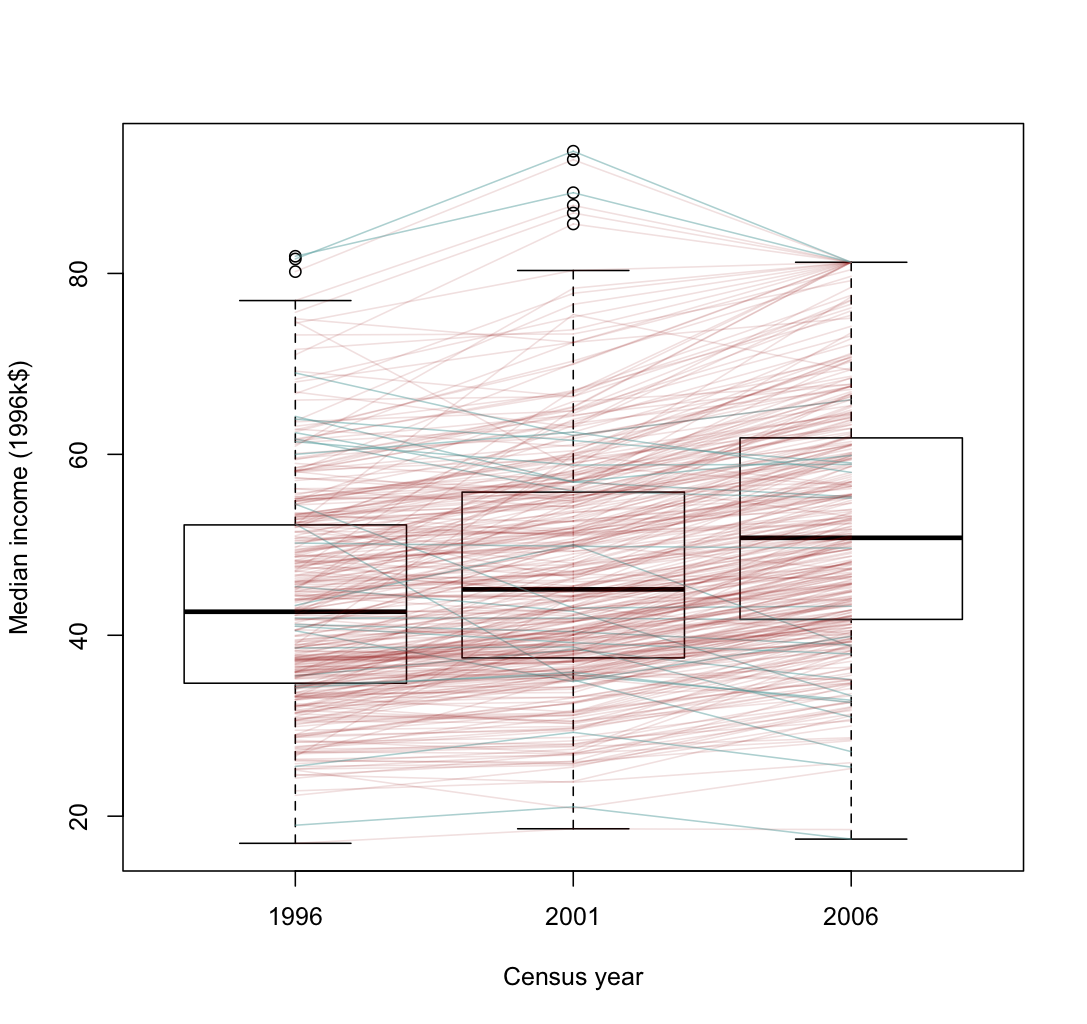
It’s clear from this graph that most areas had an increase in median income, but that the increase was larger in wealthier areas.   A few areas went up sharply, then down again, presumably in the dotcom crash.  Some of the larger decreases are probably due to changes in housing mix: two meshblocks in Auckland Central have declined a lot, and I expect that’s due to more small apartments.

It’s also worth noting that the percentage increase in median income is much closer to being constant across meshblocks.  In that sense the increase in inequality is not as bad as in the US, where increases in GDP have almost entirely ended up with the rich.


[Update: here’s a version where the areas that decreased from 1996 to 2006 are in a different color.  I don’t know if it helps for seeing the overall pattern.  Given more time and if WordPress took SVG, it would be possible to have mouseover labels for the meshblocks so you could see which is which.]

Drug driving tests

Stuff is reporting on drugged drivers caught since the new laws were introduced in November 2009.  The results show the police are a lot better than I expected at picking people to test:  of 514 who had a compulsory field impairment test,  455 failed, and 429 of those tested positive for one or more illegal drugs.   The drug-driving policies, at least so far, are targeting people who are a real risk (in sharp contrast to workplace drug testing, for example).

Income, taxes, and gaps

Today’s ‘Divided Auckland’ story in the NZ Herald is on taxes, claiming that taxes on the rich are lower and taxes on the poor are higher here than anywhere else in the OECD.  Now, I moved from another OECD member country about eighteen months ago, and while I’m not in the John Key category I would be safely in the upper 20% of household income both here and in the USA.  There is no question that I pay more taxes here — and I’m fine with that.

(more…)

January 30, 2012

Global temperatures for 2011

NASA’s annual summary of global temperatures is out.  2011 was not the warmest year on record, it was only ninth, a whole eighth of a degree cooler than last year.  One of the years that beat 2011 wasn’t even in the twenty-first century. [It was 1998.]

January 24, 2012

How to read road-toll statistics

Chris Triggs of the Department of Statistics at The University of Auckland was on Graeme Hill’s Radio Live show in the weekend to explain how we should read road-toll statistics. Remember … it’s not ‘killer roads’, it’s a random-chance phenomenon. Start at 24 mins 45 sec.

Gold leaf on your food, madam?

Golf leaf on food might seem terribly exotic – until you see the numbers. See Thomas Lumley in today’s Sideswipe column in the New Zealand Herald.

[update: and here’s the post that Sideswipe references]


January 19, 2012

Stay a lert. NZ needs lerts.

Q: Why does the Egg Foundation think eggs are a good breakfast food?

A: Well, the name “Egg Foundation” is a bit  of a hint. Just saying.

Q: No, why do they say that new research says eggs are a good breakfast food?

A: Because it sounds like a good excuse to advertise eggs?

Q: You know what I mean.

A: Sorry, got a bit carried away there.

Q: Well?

A: You are referring to the article about eggs increasing alertness.

Q: Yes. I assume it wasn’t a randomized trial.  Did they ask people about breakfast and alertness?

A: Not people, exactly

Q: Ah.  So it was a mouse study. They fed the mice different things and observed their alertness?

A: Not quite. It was a study of brain cells.

Q: Where did they find people to give them the brain cells?

A: That’s where the mice come in.

Q: So, what did they actually do?

A: They took brain slices from transgenic mice, modified so the cells lit up green when the right chemical pathways were activated, then they added sugar or amino acids to the slices.

Q: And what did they find?

A: Some brain cells, which are known to be involved in both feeding and in alertness, were active when they used amino acids but not when they used sugar.  They also repeated the experiment by feeding the mice before taking the brain slices, to see if they saw the same effects (and they did).

Q: So what does this tell us about eggs for breakfast?

A: Not a whole lot, actually.  Unless you’re a dead mouse.

Q: Why didn’t you complain about the lack of links to the original research?

A: Well, if a proposed US law passes (no, not the well-known one), there won’t be any original research available on the web to link to, so we might as well get used to it.  [NYT, Guardian, Scientific American, The Atlantic, Wiredothers]