November 21, 2013

Compared to whom?

The members of the Organisation for Economic Cooperation and Development (OECD) are a popular reference set when comparing NZ performance.  Or at least, they used to be. The OECD has expanded over the decades since it was formed, and not everyone’s referencing has kept up.

Yesterday, I wrote about imprisonment rates. Today, a (mostly good) Dominion Post editorial about sex education said

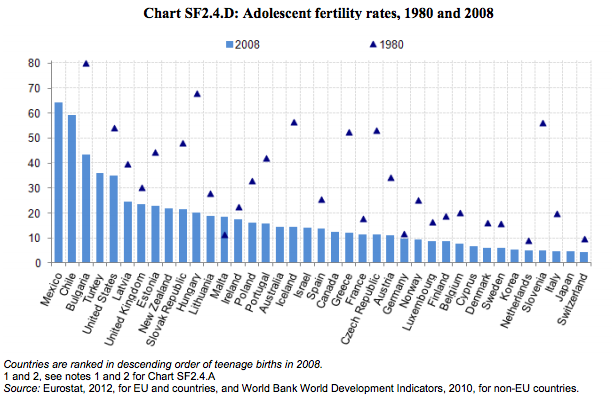
New Zealand has the third highest teen pregnancy rate among OECD countries.

In fact, the OECD said last year (their most recent report, PDF) that NZ has the ninth highest teen pregnancy rate among OECD countries:

oecd

It is third-highest among countries that joined the OECD before 1990, but that’s starting to look less like a natural comparison.

The other point the graph makes is that teenage pregnancy is less common than it used to be, essentially everywhere where there is data. The editorial argues that the internet has made alternatives to proper sex education worse than they used to be.  That’s a reasonable position on some important issues, but it clearly doesn’t apply to teen pregnancy, and it would be nice to see this admitted more often.


November 20, 2013

We’re not number two.

From Stuff

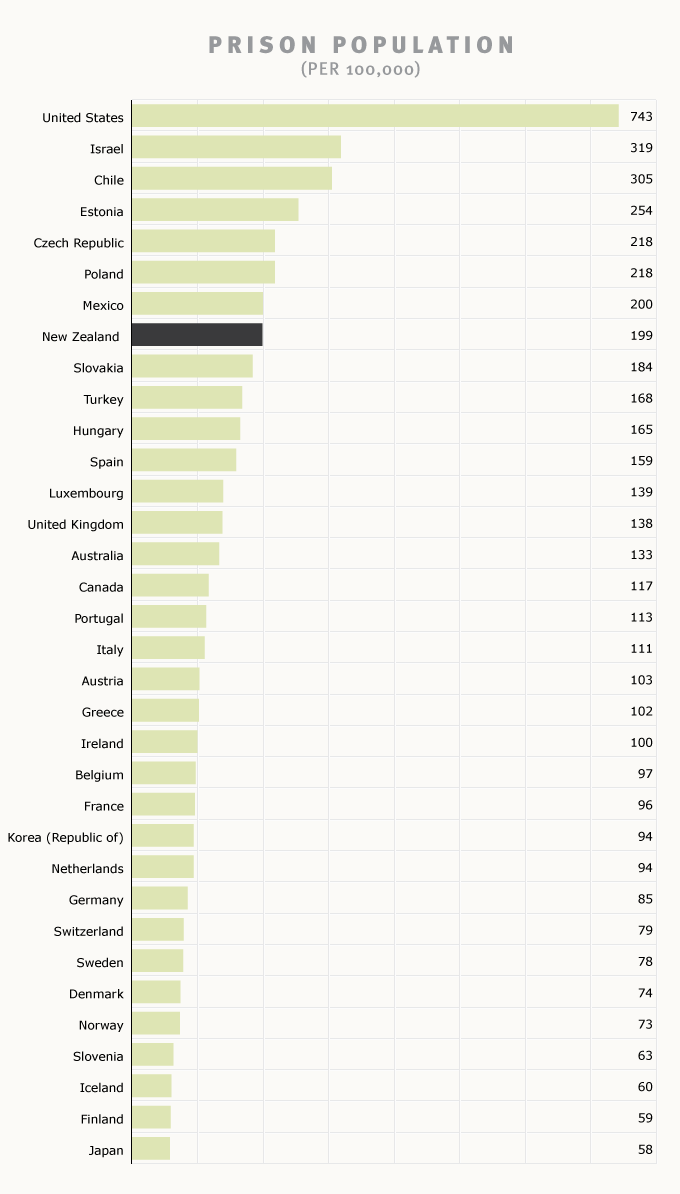
New Zealand had the second highest imprisonment rate in the world, with an overrepresentation and disproportionate rate of Maori prisoners. “This has attracted comment from the United Nations and overseas media.”

This is half right. There is certainly serious overrepresentation of Maori in the prison population. However, New Zealand doesn’t have the second highest imprisonment rate in the world. Or even in the OECD. And it’s not hard to find this out.

The Encyclopedia of New Zealand, Te Ara,  gives this graph, dated May 2011, for OECD countries, referencing the International Center for Prison Studies (PDF)

prison

Wikipedia has NZ in 74th place for all countries, referencing the same source, behind most of the Caribbean, much of the former Eastern Bloc, and Samoa. So, whether you’re going for easily accessible online references like Wikipedia and Te Ara or actual expert data curation, you get the same results.

New Zealand’s imprisonment rate is too high. I don’t see a good reason why it should be much higher than, say, Australia or the less wealthy Western European countries. But it’s not second in the world by any reasonable definition of “the world”.

(Update: Graeme Edgeler wrote about another airing of this recently, which I had thought I remembered, but couldn’t find when writing this.)

Statistician statistics: gender, race, ethnicity

New data from the American Community Survey on race, ethnicity, and gender balance in science/technology employment.  (more…)

What do statisticians do all day?

The annual posting of our second-semester MSc and Honours project topics, which were handed in this week.

  • Modelling paua (abalone) growth and investigating seasonal patterns of growth in relation to temperature and genetic family
  • Investigating spatial and temporal patterns in trawl survey time series
  • Identification of spatial and temporal patterns in, and the factors affecting New Zealand fishery catch composition
  • Are newspaper health stories reproducible?
  • Evaluating computer generated designs
  • Model selection methods for supersaturated designs
  • Bayesian Estimation of Undetectable Reverberation Lags
  • Interactive web graphics using widgets and gridSVG
  • Producing HTML Tables with the xtable Package
  • Software for Time Series of Counts
  • Prediction of Super 15 and NRL games
  • Optimal portfolio rebalancing strategies
  • Creating synthetic census datasets using multiple imputation
  • Sustainable Spending in retirement
  • Predictors of on-road particle concentrations
  • Geographic and other sources of variation in the normal range of echocardiographic measurement of the heart
  • Modelling air quality extremes
  • Confidence Regions for Categorical Data
  • Clustering Populations using short tandem repeats
  • Are invariant sites really necessary in phylogenetic inference?
  • Working Likelihood Test
  • Meta analysis of smoking cessation trials
  • Searching for significant differential rules
  • On the use of sequentially normalized maximum likelihood for selecting the order of autoregressions when the model parameters are estimated by forgetting factor least-squares algorithms
  • Connections between the coalescent and birth-death sampling processes
November 19, 2013

Briefly

  • Animated visualisation of motor vehicle accident rates over the year in Australia. Unfortunately it’s based on just one year of data, which isn’t really enough. And if you’re going the effort of the animation, it would have been nice to use it to illustrate uncertainty/variability in the data
  • Randomised trials outside medicine: the combined results of ten trials of restorative justice conferences. Reoffending over the next two years was reduced, and the victims were happier with the handling of the case. (via @hildabast)
  • How much do @nytimes tweets affect pageviews for their stories?

Tune in, turn on, drop out?

From online site Games and Learning

A massive study of some 11,000 youngsters in Britain has found that playing video games, even as early as five years old, does not lead to later behavior problems.

This is real research, looking at changes over time in a large number of children and it does find that the associations between ‘screen time’ and later behaviour problems are weak. On the other hand, the research paper concludes

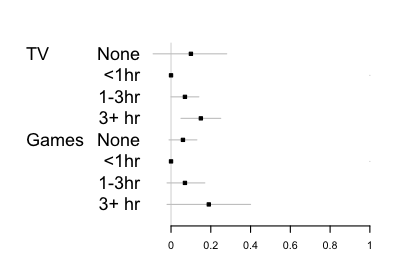
 Watching TV for 3 h or more at 5 years predicted a 0.13 point increase (95% CI 0.03 to 0.24) in conduct problems by 7 years, compared with watching for under an hour, but playing electronic games was not associated with conduct problems.

When you see “was not associated”, you need to look carefully: are they claiming evidence of absence or just weakness of evidence. Here are the estimates in a graphical form, comparing changes in a 10-point questionnaire about conduct.

video


The data largely rule out average differences as big as half a point, so this study does provide evidence there isn’t a big impact (in the UK). However, it’s pretty clear from the graph that the data don’t provide any real support for a difference between TV and videogames.  The estimates for TV are more precise, and for that reason the TV estimate is ‘statistically significant’ and the videogames one isn’t, but that’s not evidence of difference.

It’s also interesting  that there’s mild support in the data for ‘None’ being worse than a small amount. Here the precision is higher for the videogame estimate, because there are very few children who watch no TV (<2%).

Live bitcoin map

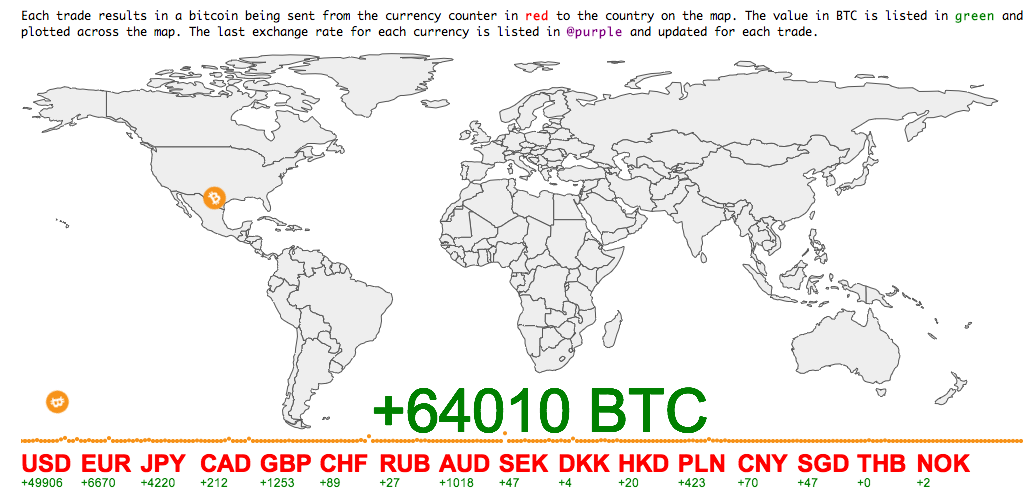
Via Business Insider, a live map of which currencies are being spent on Bitcoins

bitcoin


The Business Insider post says

[I]n the time we’ve watched it, it becomes clear that China really is big into Bitcoin relative to the rest of the world.

Below is a brief snapshot of what we saw in which the transactions were dominated by Chinese trading (at other times it’s more even, with more US action).

A big reason for the variation would be time of day, but my map above ran for about 17 hours, and it shows much more US than Chinese bitcoin activity — and even more Australian than Chinese.  Longer sampling times are clearly needed to say anything definite.

The map website says “watch the world’s currencies flow into BTC in realtime”, which is the sort of exaggeration that’s unfortunately common with bitcoin enthusiasts. These are exchanges of bitcoin for other currencies: one person gets USD and gives up BTC, the other person gets BTC and gives up USD. The only net flow into (or out of) bitcoin comes from the seller’s profit (or loss) as bitcoin changes in price — and that can be much more easily and accurately estimated from the exchange rates, without needing to track individual transactions.


November 18, 2013

Stat of the Week Competition: November 16 – 22 2013

Each week, we would like to invite readers of Stats Chat to submit nominations for our Stat of the Week competition and be in with the chance to win an iTunes voucher.

Here’s how it works:

  • Anyone may add a comment on this post to nominate their Stat of the Week candidate before midday Friday November 22 2013.
  • Statistics can be bad, exemplary or fascinating.
  • The statistic must be in the NZ media during the period of November 16 – 22 2013 inclusive.
  • Quote the statistic, when and where it was published and tell us why it should be our Stat of the Week.

Next Monday at midday we’ll announce the winner of this week’s Stat of the Week competition, and start a new one.

(more…)

November 16, 2013

What people die of

The Institute for Health Metrics, at my previous university  in Seattle, has a new tool for visualising the causes of death and disability across the world with interactive graphics.

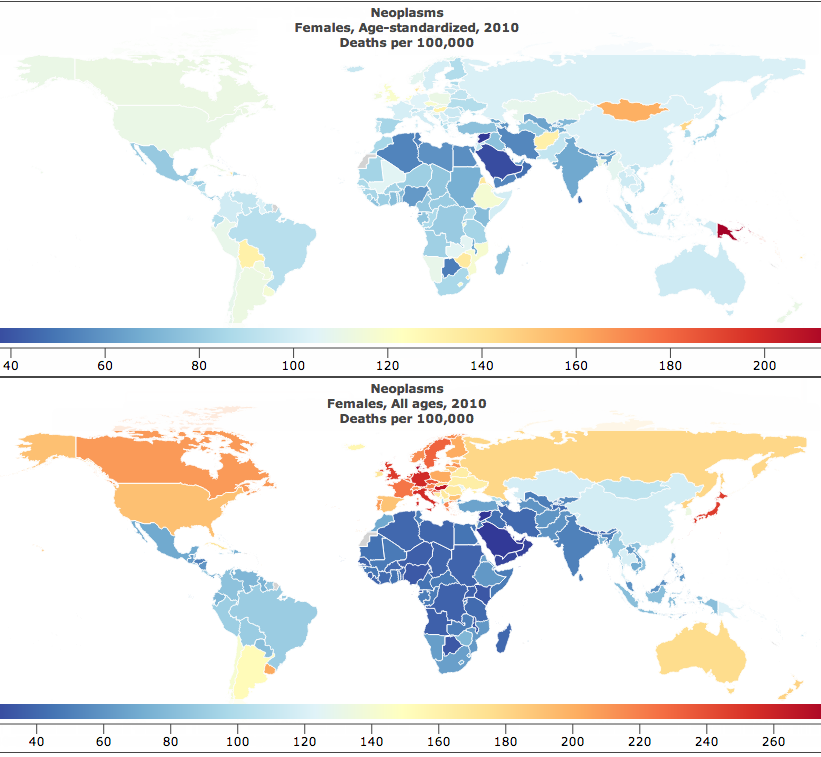
This pair of maps is for cancer in women.

cancer


The lower map is just cancer deaths per 100,000 women.  That’s the easiest sort of number to obtain, but the problem with it is obvious: the orange and red countries are mostly just the places where the female population is older than average.

The upper map is age-standardised deaths per 100,000 women. That is, you take the rate in your country for women of a particular age, say 72 years old , and multiply by the proportion of 72-year olds in the UN’s standard reference population. When you do this for each year of age and add up the results, you get an estimate of what the cancer rate differences really are like, averaged over ages.

The map looks completely different after standardising by age. In particular, there’s a lot less variation between countries. The lowest rate is in Saudi Arabia, which is wealthy enough to afford good medical care but still has low rates of many cancer risk factors in women. The highest rate is Papua New Guinea, which has very high rates of cervical cancer (affecting younger women than many cancers).

Fun with percentages

This week there was a quarterly report estimating smartphone market share for different operating systems, which turned out to be  packed with trapdoors for the unwary reporter.  The NZ media largely avoided  the problems (mostly by sensibly ignoring the report) but many international tech sites leaped in with both feet.

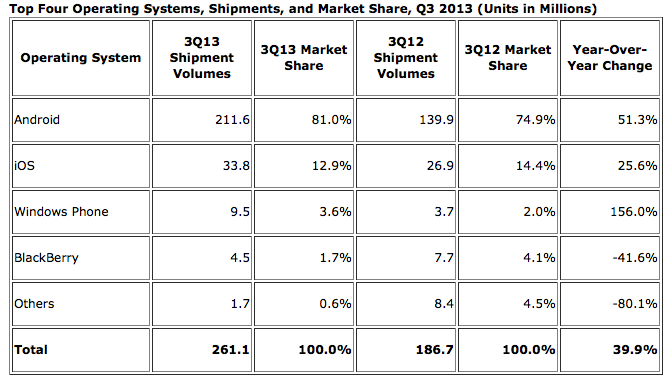
The basic information is in this table:
iphone


There are some important nerdy details in interpreting the numbers, such as the difference between “shipments” and “sales,” but we can ignore those for now. The main problem came in picking which numbers to report. The popular ones were the 81.0% market share for Android, the 1.5% fall in market share for Apple’s iOS, and the 156% increase in shipments for the Windows Phone.

The big rise in Windows phones is due (as the report points out) to the fact that there were basically no Windows phones being sold last year, and that’s now increased to some Windows phones being sold — not only is Windows still well behind iOS and Android, but its increase in actual phones shipped was smaller than the increase for either iOS or Android.  That’s all clear just from the numbers in the report.

Android has obviously been really successful, but 80% market share doesn’t mean quite as much as it sounds: this is just one quarter of phone shipments, and nowhere near 80% of the smartphones already out there are Android — the installed base is still much larger for iOS. If you’re writing the next Candy Crush or Angry Birds, what you care about most is the number of potential customers on each operating system. On the other hand, if you’re interested in current cash flow, so that one quarter’s shipments are relevant, you care about revenue or profit, which are lower per phone for Android (which is why I now have an Android phone).

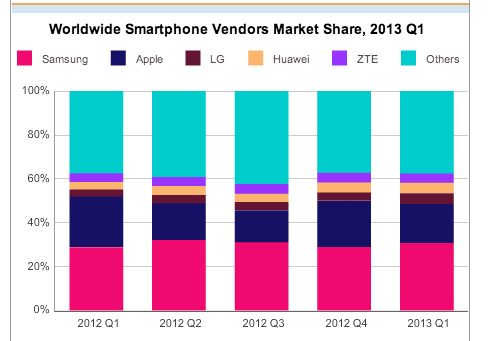
And, finally, if you’re a tech writer, as Kit Eaton points out, you should know enough about the industry to realise that Apple made a much-anticipated announcement of two new iPhone models at the end of September.  Given a choice, many people (and not just psychotic Apple fanboys) would want to wait until the new phones appeared, either to buy one or to get discounted obsolete model. You’d expect iOS sales to be lower  in the preceding quarter. This isn’t just hypothetical: the chart from the April IDC press release (we’re not digging very deep here) shows the contraction and expansion in Apple market share around the release of the previous model, the iPhone 5, last September.

phones


On the  other hand, at least the fact that last year also had a new iPhone release means that ignoring the context sort of cancels itself out.

(via @juhasaarinen)