November 13, 2013

Two open-data links

Actually existing open data in Australia (via @juhasaarinen):

The number of datasets available on the Government’s open data website has slimmed by more than half after the agency discovered one third of the datasets were junk….

“We unfortunately found that a third of the “datasets” were just links to webpages or files that either didn’t exist anymore, or redirected somewhere not useful to genuine seekers of data,” Sheridan said.

Do-it-yourself open data in NZ : Graeme Edgeler on the Official Information Act

Some time last year [note: 2010], I realised that you could find stuff out by asking the Government. It used to be I’d have had a discussion with someone, or read a news story or made a blog comment and thought to myself “I wonder if they …” or “how many …” and I wouldn’t try to find out. And then once – for some reason – likely the personal satisfaction of knowing I was right about something – I flicked off an email to a government department asking them for some small piece of information.


November 12, 2013

Memorable data visualisations

From phys.org

With Harvard students Azalea A. Vo and Shashank Sunkavalli, as well as MIT graduate students Zoya Bylinskii and Phillip Isola, the team designed a large-scale study—in the form of an online game—to rigorously measure the memorability of a wide variety of visualizations. They collected more than 5,000 charts and graphics from scientific papers, design blogs, newspapers, and government reports and manually categorized them by a wide range of attributes. Serving them up in brief glimpses—just one second each—to participants via Amazon Mechanical Turk, the researchers tested the influence of features like color, density, and content themes on users’ ability to recognize which ones they had seen before

The researchers talk about what features were present in the more-memorable graphs, which tended to be visually dense and not to be of standard forms.

It’s good to see empirical evaluation of theories about graphics. However, as they admit,  ‘memorable’ may not be the right criterion. Even if it isn’t ‘memorable’ in the eyeball-bleach sense, memorability may not be a good proxy for informativeness.

This is your sampling on drugs

From Stuff, this morning

This year, and for the first time in New Zealand, Fairfax Media is partnering with the Global Drug Survey to help create the largest and most up-to-date snapshot of our drug and alcohol use, and to see how we compare to the rest of the world.

That all sounds good. The next line (with a link) is

Take the survey here.

That doesn’t sound so good.

This research group has been running a survey in partnership with UK clubbing magazine Mixmag for years, and last year branched out to ‘Global’ status with the help of the Guardian. Not all that global, though: more than half the respondents were from the UK, with half of the rest from the US.  As you might expect, the respondents were more likely to be from demographic groups with high drug use: overrepresented attributes included young, male, student, and gay or bi.   The research team and their expert advisory committee includes experts in a wide range of areas needed to design and interpret a study of this sort, with one exception: they don’t seem to have a statistician.

What are the results going to be useful for? Clearly, any estimates of prevalence of drug use will be pretty much useless if the survey oversamples drug users as it has in the past. Comparisons with past surveys done by different methods will be completely useless.  International comparisons within the survey will be a bit dodgy, since the newspapers taking part will reach different segments of each country– readers of the Fairfax media are quite a different subpopulation than Guardian readers. 

Useful information is more likely to be obtained on drug prices, on subjective experience of drug taking, on harm people experience from different drugs, and on comparison between drugs: eg, among people who’ve tried both MDMA and cocaine, which do they keep using and why?  In countries where there is no high-quality survey information, the semi-quantitative information about drug use might be helpful, but that’s probably not true for NZ or the USA.  Certainly for alcohol use, the NZ Health Survey would be more reliable, and the estimates of street price  of drugs from Massey’s IDMS should be pretty good.

For New Zealand, the most useful outcome would be if the survey provokes a repeat of the NZ Alcohol and Drug Use Survey, which was run in 2007-2008.

[Update: the NZ Health Survey was planned to have a drug use module in 2012. I can’t find any confirmation that it actually happened, or any planned release date for the data.  See the comments. The module was administered and data will appear next year. So, it’s definitely not true that there hasn’t been an NZ survey since 2007/8, contrary to the story]
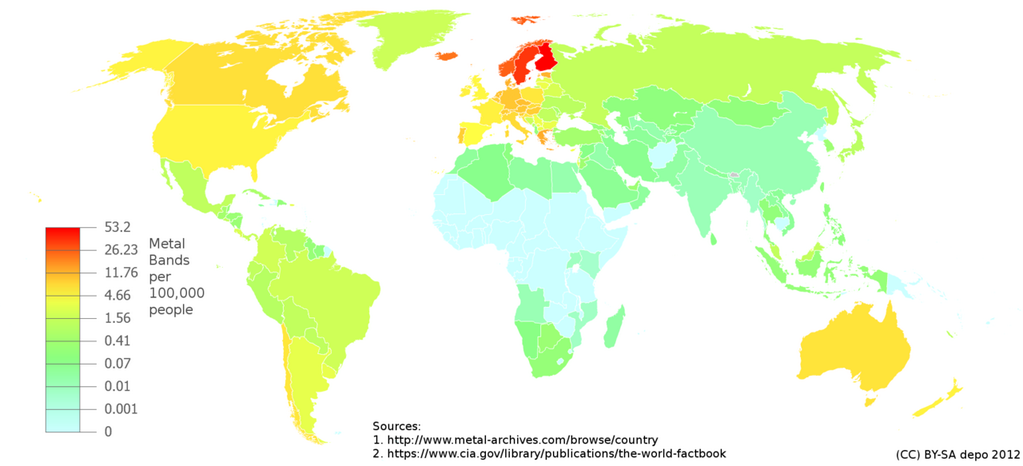

Screaming above our weight

Via @BenAtkinsonPhD: a map of heavy metal bands per capita

metal


We’re ahead of the US, though behind the Scandinavian countries, as usual.

(for foreigners: NZ political cliche)

November 11, 2013

Data-based journalism

Data journalism can range from ordinary journalism carried out with enough numeracy to use published data, to informative and insightful displays of information, to analysis, searching and linkage that wouldn’t be possible without computers.

The Herald and Keith Ng have an example of the last type: an analysis of New Zealand’s property records to find property owned by MPs but not declared in the Register of Pecuniary Interests. Property ownership records let you find out who owns a particular piece of land. They aren’t set up to let you go the other way and ask what property is owned by a particular individual, but computers can easily solve that sort of problem by brute force. There are other complications, since land might well be owned by a trust, not by the MP personally; these increase the effort, but don’t make it impossible.  It doesn’t seem that the omissions in reporting violate the law — if the MPs were really trying to hide their holdings, they’d do a much better job — but it exposes a loophole.

This sort of search requires doing things to large, probably messy databases, but it also requires manual verification of all the findings, and the involvement of someone who can ask public figures for explanations — if the Herald asks questions and they don’t get answers, that’s news.

Stat of the Week Competition: November 9 – 15 2013

Each week, we would like to invite readers of Stats Chat to submit nominations for our Stat of the Week competition and be in with the chance to win an iTunes voucher.

Here’s how it works:

  • Anyone may add a comment on this post to nominate their Stat of the Week candidate before midday Friday November 15 2013.
  • Statistics can be bad, exemplary or fascinating.
  • The statistic must be in the NZ media during the period of November 9 – 15 2013 inclusive.
  • Quote the statistic, when and where it was published and tell us why it should be our Stat of the Week.

Next Monday at midday we’ll announce the winner of this week’s Stat of the Week competition, and start a new one.

(more…)

November 10, 2013

Data visulisation (with cartoons and video)

From Fresh Spectrum,

The natural constraints of a paper journal didn’t give me an opportunity to dive into the practical side of the subject, but that’s why it’s nice to have a blog. This post is the first in a series I have planned on data visualization. Call it an introduction to interactivity, hope you like it.

The basic reason for interactivity: not everyone wants the same numbers


Typhoon Haiyan context

There are reports that as many as 10,000 people may have died on the Philippine island of Leyte on Friday, drowned in the storm surge or killed by collapsing buildings.

Leyte is roughly comparable in size and population to the Auckland Region (about 40% larger). Fewer than 8000 people died in Auckland in all of 2012.

A disaster

November 8, 2013

Spending on foreign aid

It’s been a while since the last StatsChat bogus poll, so here’s a new one. Answer it before you read on

(more…)

November 7, 2013

Why you should eat in crowded food halls

There’s a couple of posts being promoted on the internet about an important and relatively subtle form of selection bias.  Epidemiologists know it as Berkson’s Paradox, in modern causal inference terminology it’s ‘conditioning on colliders’, and for an economist it’s a consequence of production-possibility frontier.

The basic issue is very simple. As Gabriel Rossman puts it at The Atlantic

 There is no ontological reason why we can’t have shoes that are both hideous and uncomfortable but rather there is a practical reason in that nobody wears shoes that are terrible in every way and so such shoes don’t make it unto the market. 

In the same way, there’s no necessary reason why cricketers who are good at bowling have to be bad at batting.  Being able to deliver the ball so it misleads or outpaces the batsman doesn’t make it any harder to spot bowling trickery or to react fast. And in fact, if you look at 12-year-olds, often the same kids are good at batting and bowling.  In international-level cricket, though, all-rounders are pretty rare, and someone who can take 5 wickets in an Test innings is very unlikely to be able to score a Test century.  The slight positive correlation you see in kids turns into a strong negative correlation in adults. The reason is that getting into an international cricket team requires you to be very, very good at batting or very, very good at bowling. Since it’s more likely that you’re very, very good at one thing than two, most international cricketers are either batsmen or bowlers, but not both. Among those who are selected, there’s a negative correlation.

There are examples in the social sciences: opposition to marijuana legalisation is positively correlated with opposition to government wealth redistribution in the US as a whole, but uncorrelated among Republican voters.

There are examples in medicine: the genetic variant Factor V Leiden is strongly associated with deep-vein thrombosis in the population in general, but not at all predictive of recurrence in people who have already had one.

And there are examples in dining: for a given price, a successful restaurant has to do well enough on some combination of food quality, pleasant ambience, trendiness, etc. So these will end up negatively correlated, and if you want good inexpensive food in downtown Auckland, try one of the Asian food courts.

(via @gnat, who points to one of the posts and notes: Anyone who thinks it’s possible to draw truthful conclusions from data analysis without really learning statistics needs to read this.)