September 23, 2013

Unclear on the pie chart concept

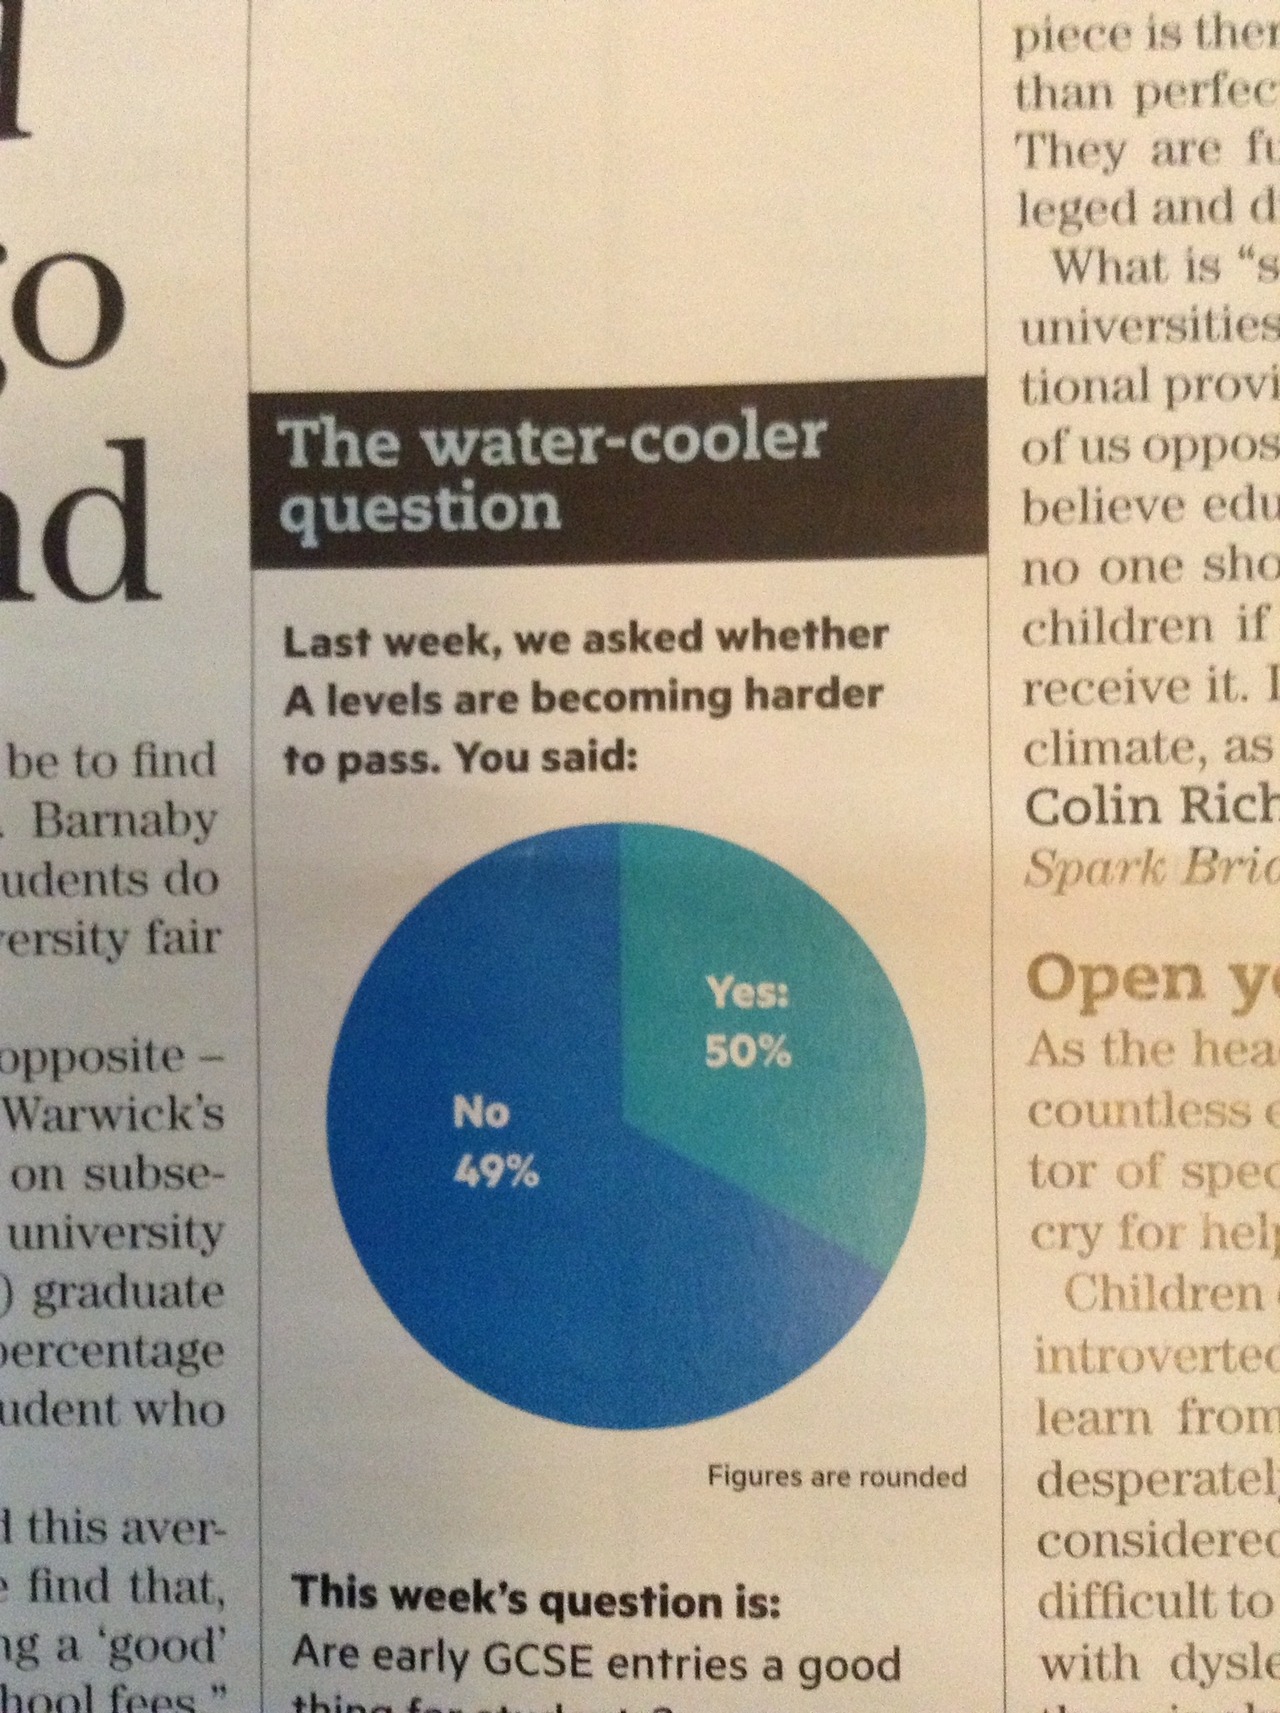
The pie-chart problems that Melbourne’s Herald-Sun had with their bogus polls appear to be spreading. This one is from wtfviz.net (via @TimHarford), and apparently comes from Britain’s TES magazine.

tespie

I suppose it’s encouraging that this sort of thing seems only to happen for bogus polls, not for actual data.


Real estate data visualisation

Det Mackey suggested we look at Grieg’s Hamilton and their graphs.

Some of these are quite good.

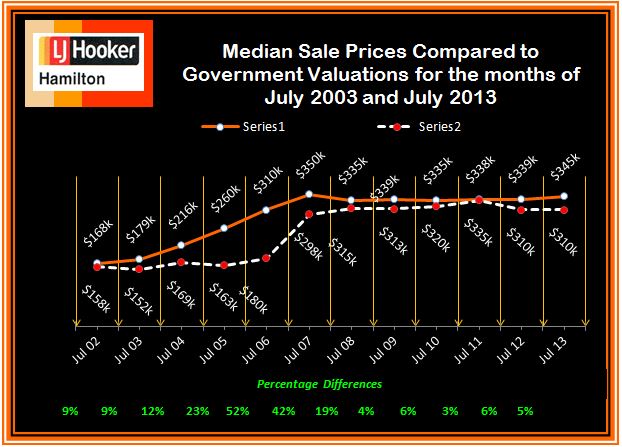
For example, this one shows how median sale price and CV change over time. The increase of sale price relative to government valuation in the boom is clear, as is the lack of increase since then.  Also, the variations in the median CV would give some idea of the extent to which differences in median price are due to changes in which houses are selling, versus changes in how much they are selling for.  The lack of a legend on the two series is a bit unfortunate, but it’s pretty obvious which is which. A graph like this would improve a lot of the newspaper stories about real estate prices.

CV-v-MS-July-2002-2013-3

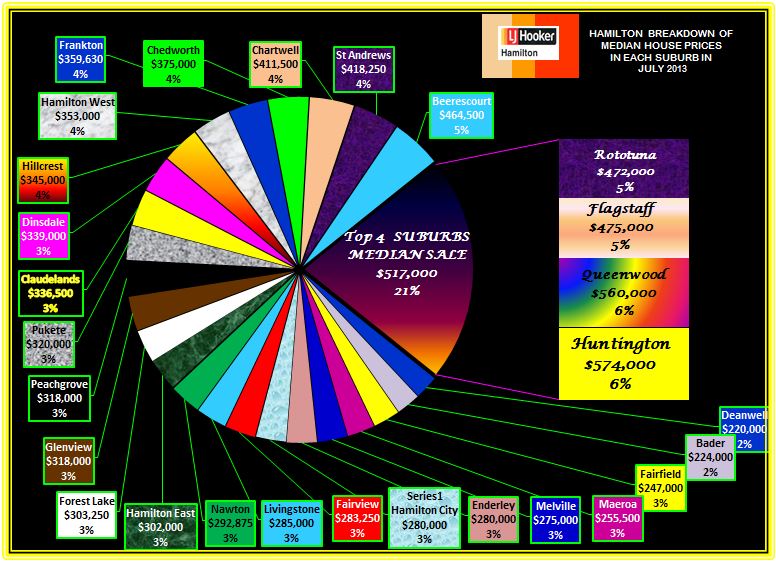
This graph, on the other hand, I think is supposed to show a comparison of median sale price across suburbs.  Apart from aesthetic objections, it doesn’t really work because median sale prices by suburb are not components of a total in any meaningful way, so the ‘pie’ metaphor isn’t doing any useful work.

Suburban-Median-Prices-July-2013


The other graphs on the site fall somewhere in between: they convey information, but often in ways that could have been more effective.


Stat of the Week Competition Winner: September 14 – 20 2013

Thank you for your nominations in this week’s Stat of the Week Competition.

Two of the nominations were about arithmetic – percentage increase and closing speed calculations – and two were more interesting examples about coffee and beer drinking. Thomas had posted earlier about the coffee drinking example (although Dave Tattersfield added some more useful information to his nomination).

So, this week we’ve chosen Nick Iversen’s curious sample-size-of-one beer-drinking nomination to be our Stat of the Week:

Under limit after 13 beers in 2 hours

This statistic doesn’t ring true and defies common sense.

The article says that a police officer who drank 13 beers in two hours remained under the legal drink-driving limit of 80. That’s incredible and I don’t believe it.

If we consult the tables at http://www.moderation.org/bac/bac-men.shtml we see that if a heavy 109kg man drinks 12 beers then after 2 hours his BAC would be 148 or roughly twice the limit.

The story can only be true if the police officer is much heavier than 109kg (say twice that) or if the beer is low alcohol and in either case the story is dishonestly misleading.

There appears to be a photograph of the policer office in question back in 2010 here (second from the left).

Congratulations Nick and thanks for all the nominations!

Stat of the Week Competition: September 21 – 27 2013

Each week, we would like to invite readers of Stats Chat to submit nominations for our Stat of the Week competition and be in with the chance to win an iTunes voucher.

Here’s how it works:

  • Anyone may add a comment on this post to nominate their Stat of the Week candidate before midday Friday September 27 2013.
  • Statistics can be bad, exemplary or fascinating.
  • The statistic must be in the NZ media during the period of September 21 – 27 2013 inclusive.
  • Quote the statistic, when and where it was published and tell us why it should be our Stat of the Week.

Next Monday at midday we’ll announce the winner of this week’s Stat of the Week competition, and start a new one.

(more…)

September 22, 2013

Briefly

  • Careers: The number of people getting statistics degrees in the US has doubled in the past five years (and they’re still able to get jobs)
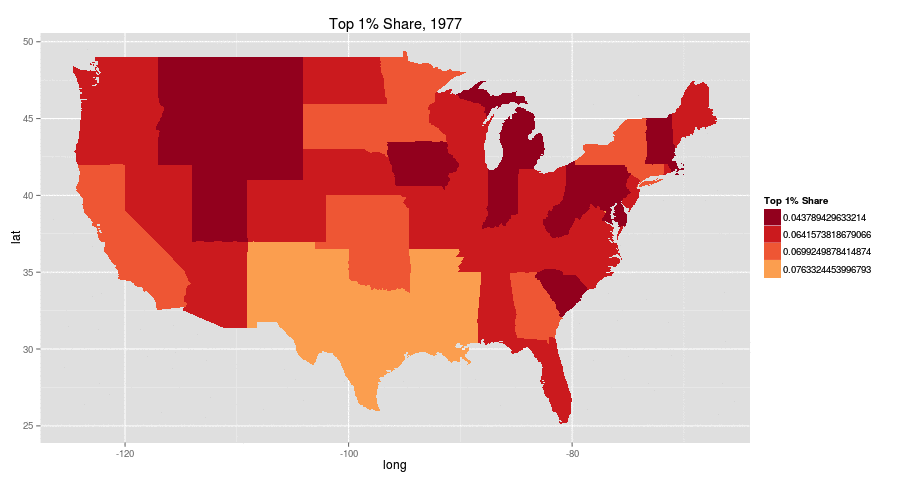
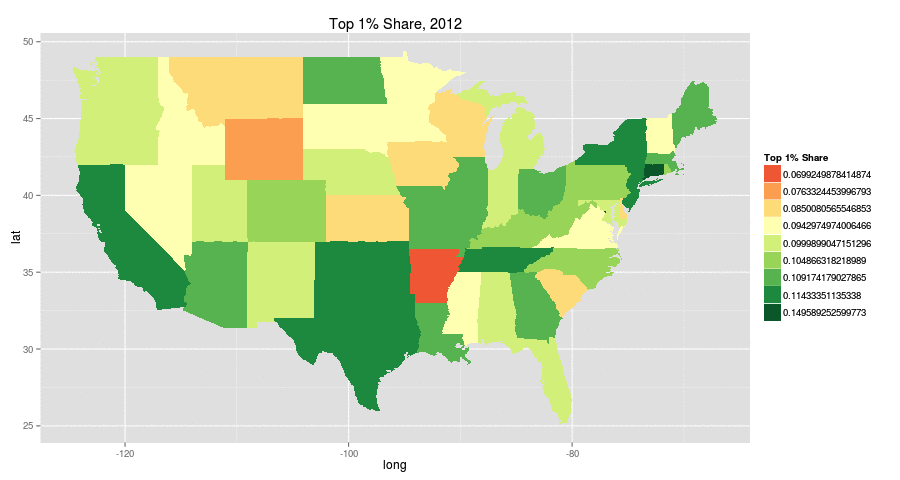
  • Increasing inequality in the US from 1977 to 2012 (it happens in other places too): top 1% share of income.  The colour choice is a bit unfortunate (red: more equal, green:less equal). There are animated pictures and more inequality measures in the original

aqzaxe9-1aqzaxe9

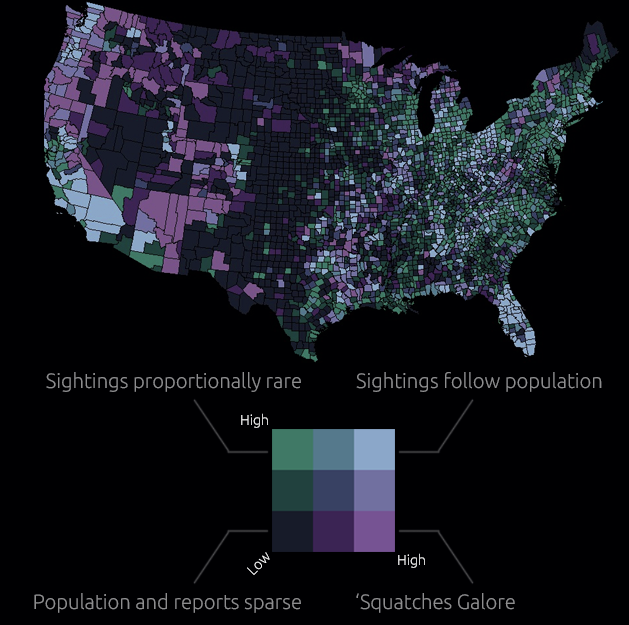
  • Map of sasquatch sightings in the US. The original has all the sightings as well as this map cross-referenced with population density. Remember, just because you can measure it doesn’t mean it exists

sasquatch

  • Software for drawing data-based maps: CartoDB. Has both free and paid versions.  Worth a look if you do maps.
September 21, 2013

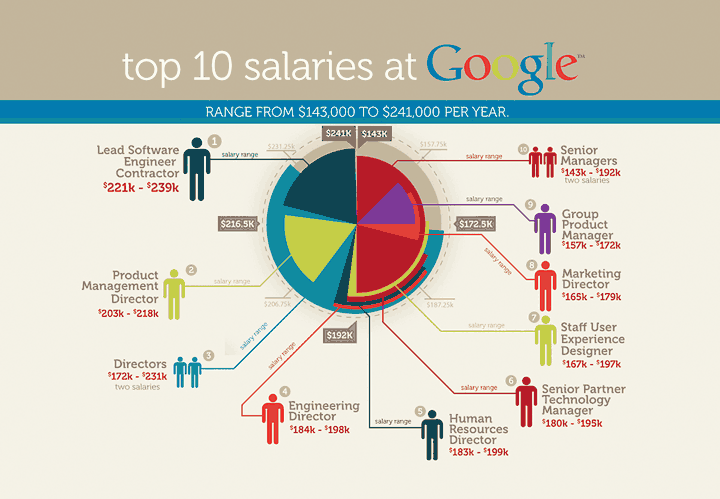
Pie chart of the week

Originally from jobvine.co.za, via a Harvard Business Review piece on data visualisation, this graph is supposed to show salary ranges for different positions.

from jobvine.co.za


It really doesn’t.  Read the HBR story for a better version.

September 19, 2013

It depends who you ask

The NZ Herald 

Privacy concerns are leading to “virtual identity suicide” with large numbers of Facebook users deleting their accounts, according to new scientific research.

A study investigating the phenomenon identified privacy as the biggest reason people are turning against the social network giant.

The new scientific research (not linked, journal not named)

The primary source for our convenience sample of Facebook quitters was the Website of the online initiative Quit Facebook Day. On this Website, Facebook users had the possibility to announce their intention to delete their account on May 31, 2010, which was declared as the Quit Facebook Day.

And what was the point of Quit Facebook Day?

In our view, Facebook doesn’t do a good job in either department. Facebook gives you choices about how to manage your data, but they aren’t fair choices, and while the onus is on the individual to manage these choices, Facebook makes it damn difficult for the average user to understand or manage this. We also don’t think Facebook has much respect for you or your data, especially in the context of the future.

So, how surprising is it that Quit Facebook Day quitters are more concerned about privacy than people who keep using Facebook?

Silver Ferns’ secret weapon

From One News NZ, a story about Bobby Wilcox, the team’s performance analyst, who has a PhD in Statistics from our department

She’s been one of the Silver Ferns most integral members for nine years, yet she’s largely anonymous outside…


[the video comes with a very annoying ad, sadly]

Petitions and polls

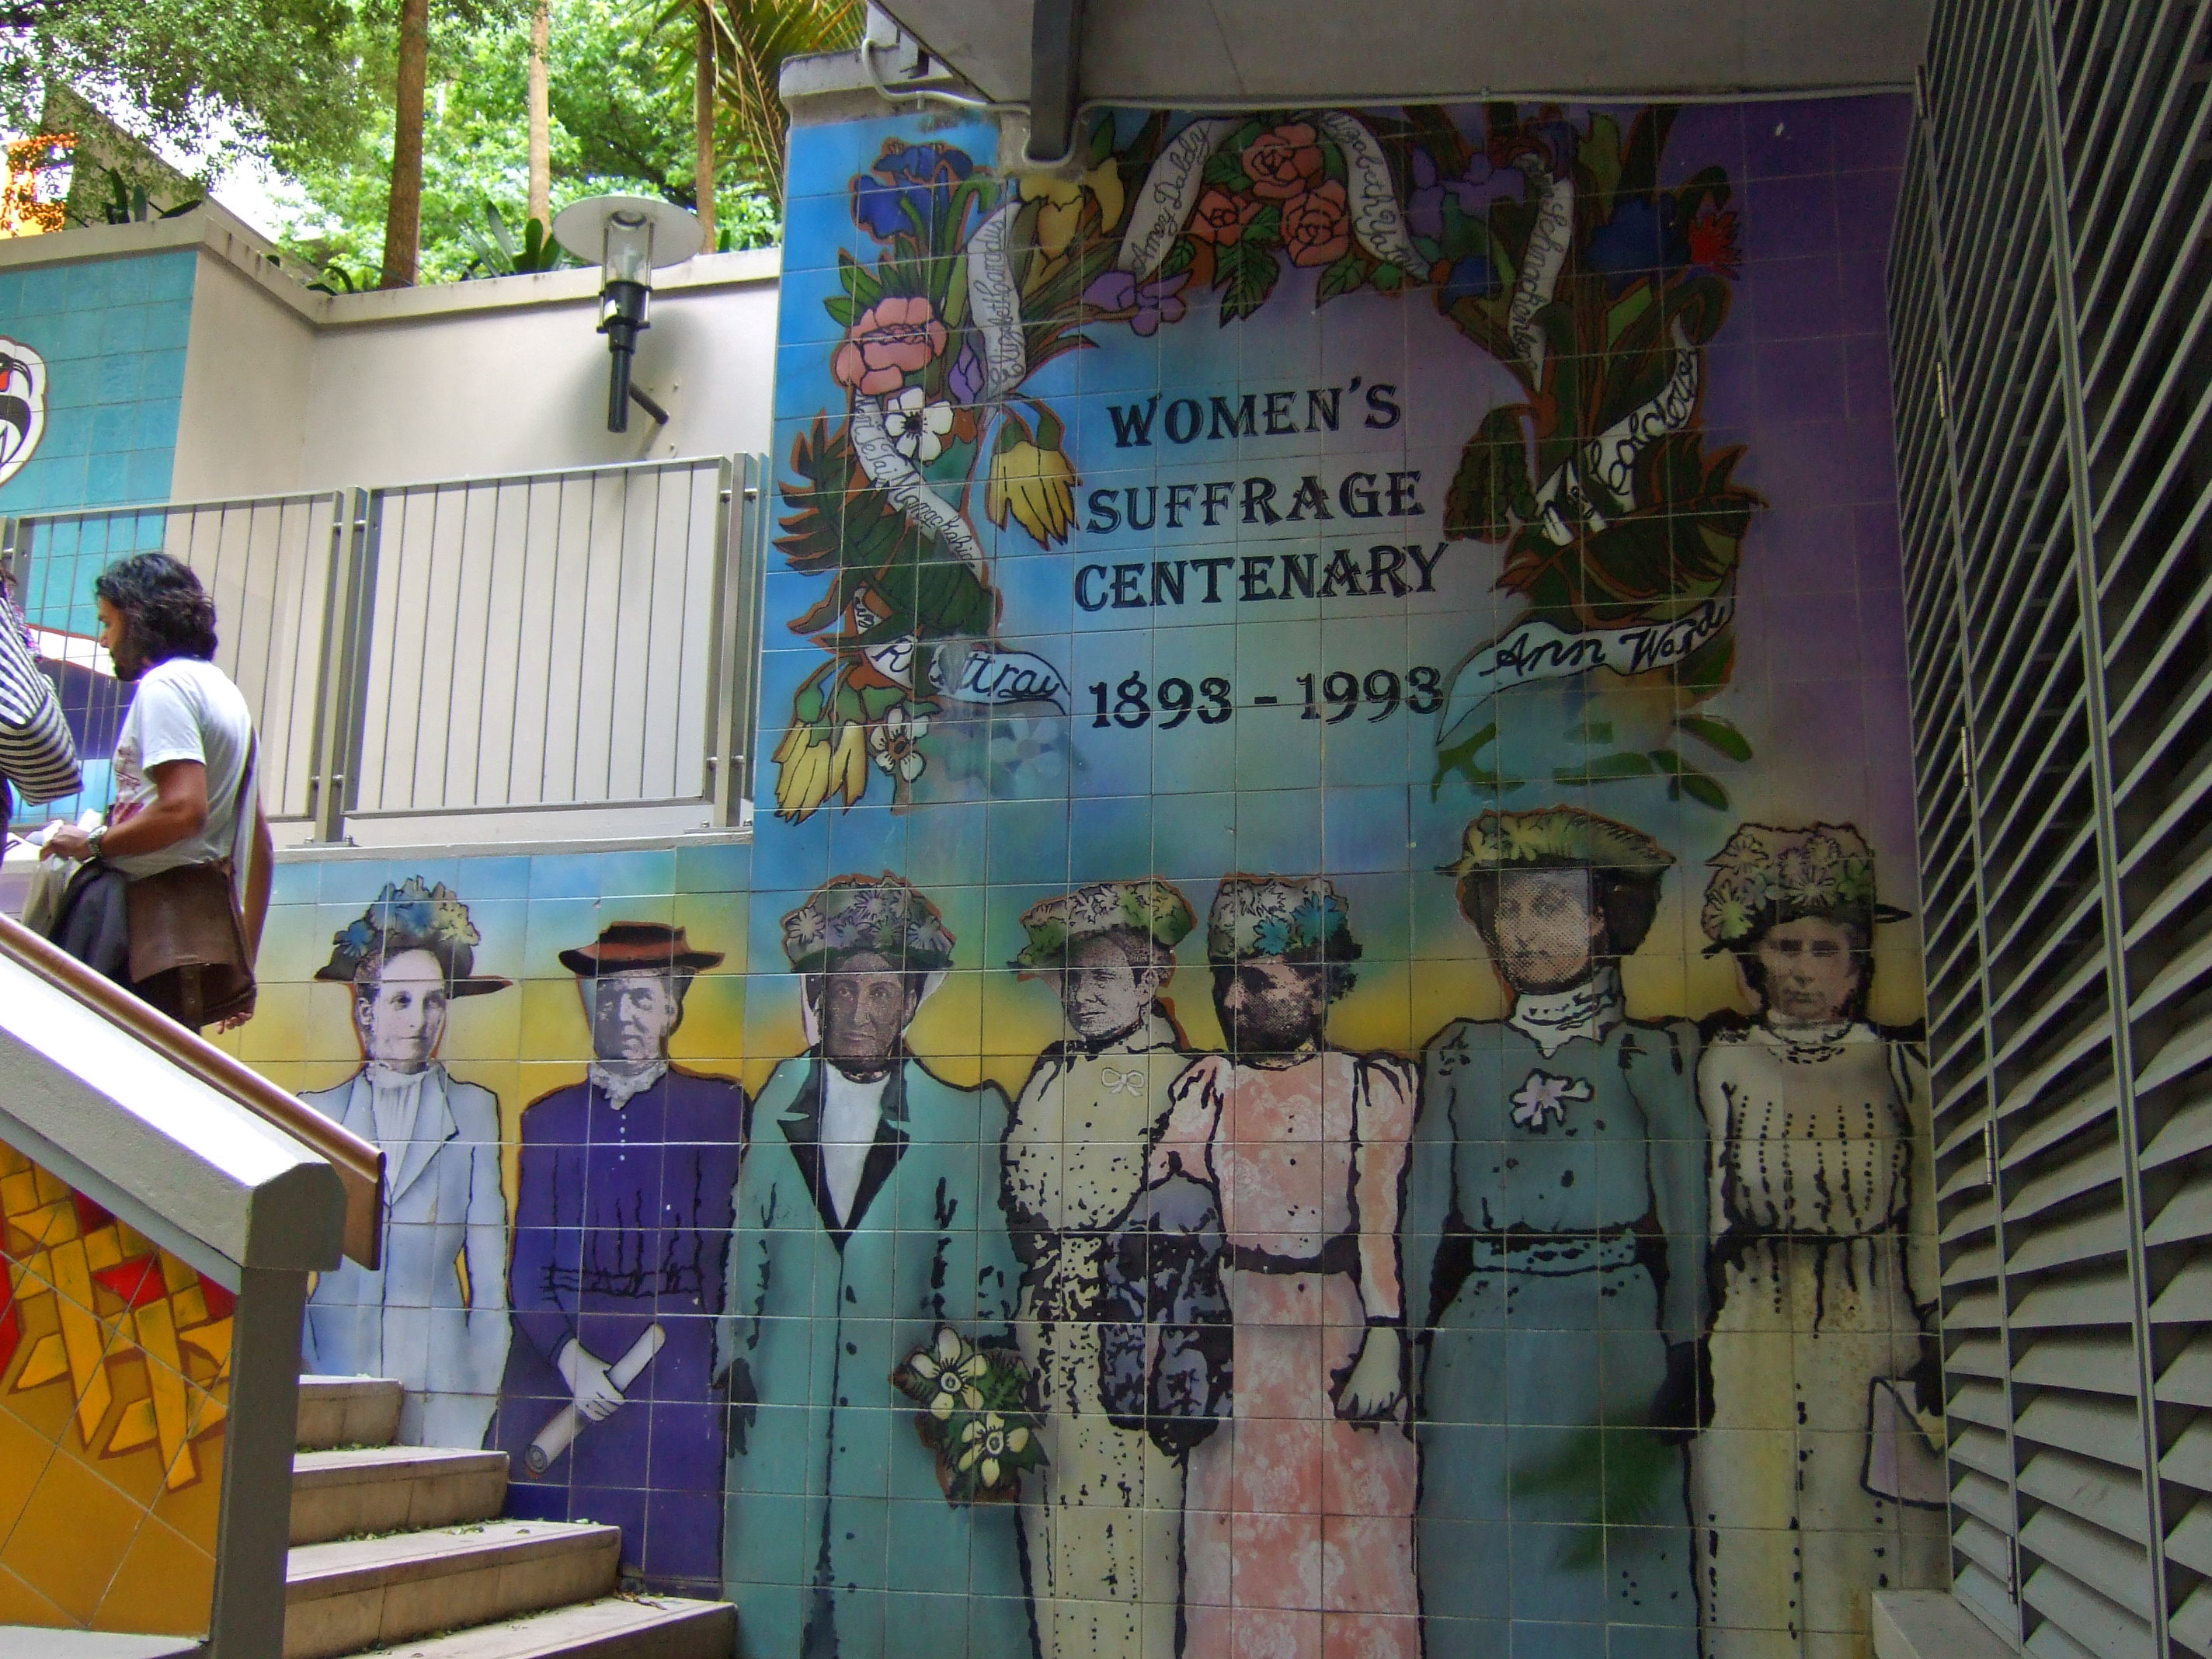
Today is the 120th anniversary of women’s suffrage in New Zealand, with commemorations in a range of places, including the Centenary fountain in Khartoum Place, Auckland
Khartoum_Place2


The petition for women’s suffrage, signed by about 24000 women, was submitted to Parliament in July 1893
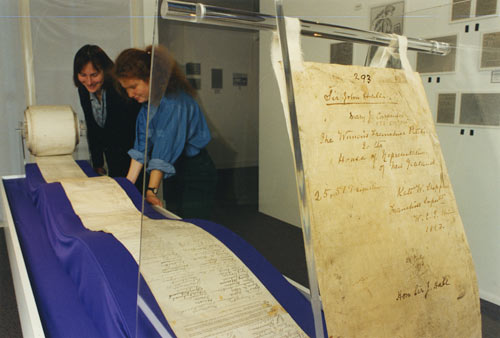
and the names of the petitioners have been digitised and made available at New Zealand History Online.

I haven’t been able to work out exactly what the adult female population of NZ was at the time, but the digital yearbook says that there were 305287 non-Maori females, that 30.94% were married and 4.11% widowed, and that there were 67000 never-married females 15 and older.  Depending on how many of the never-married 15+ were 21 or older, this gives perhaps 150000, so about 16% of the non-Maori adult female population signed the petition. That compares to modern petitions with about 2.4% of voting-age people opposing marriage equality and about 10% for the anti-asset-sales petition (though these are targeting the entire NZ voting population, not just women).

Presumably, rather more than 16% of women were in favour of getting the right to vote, but it’s always difficult to track people down and get them all to sign.  In 1893 there wasn’t an alternative: sampling hadn’t been invented, and would likely have been impractical  — certainly, calling random phone numbers wouldn’t have got you very far.

Today, we have much more accurate ways of estimating the proportion of people who support some government action. Petitions, like demonstrations, are mostly useful for signalling to the government that some issue they weren’t  aware of is actually important.  For example, the petition against animal testing for legal highs would have been effective to the extent that the government wasn’t aware people cared about the issue. For anyone who was aware this was a political issue, a well-conducted opinion poll would be more informative and should be both less expensive and more effective than a petition.

Referendum petitions, as in New Zealand and some parts of the US, are an example of this principle: if an issue can get the support of 10% of the NZ voting population, it’s probably important enough to be worth serious consideration and debate.  The threshold is weaker in many places. For example, in California a petition need only get 5% of the number of people who voted in the last election for state governor, which currently comes to under 2% of the adult population.
Briefly

  • An interactive graphic showing variation as well as trends in unemployment in the US. From eager eyes
  • Some people just can’t do simple mathematical computations, but  for those that can, they can easily be distracted by political bias. Grist describes a nice experiment by psychologist Dan Kahan and colleagues
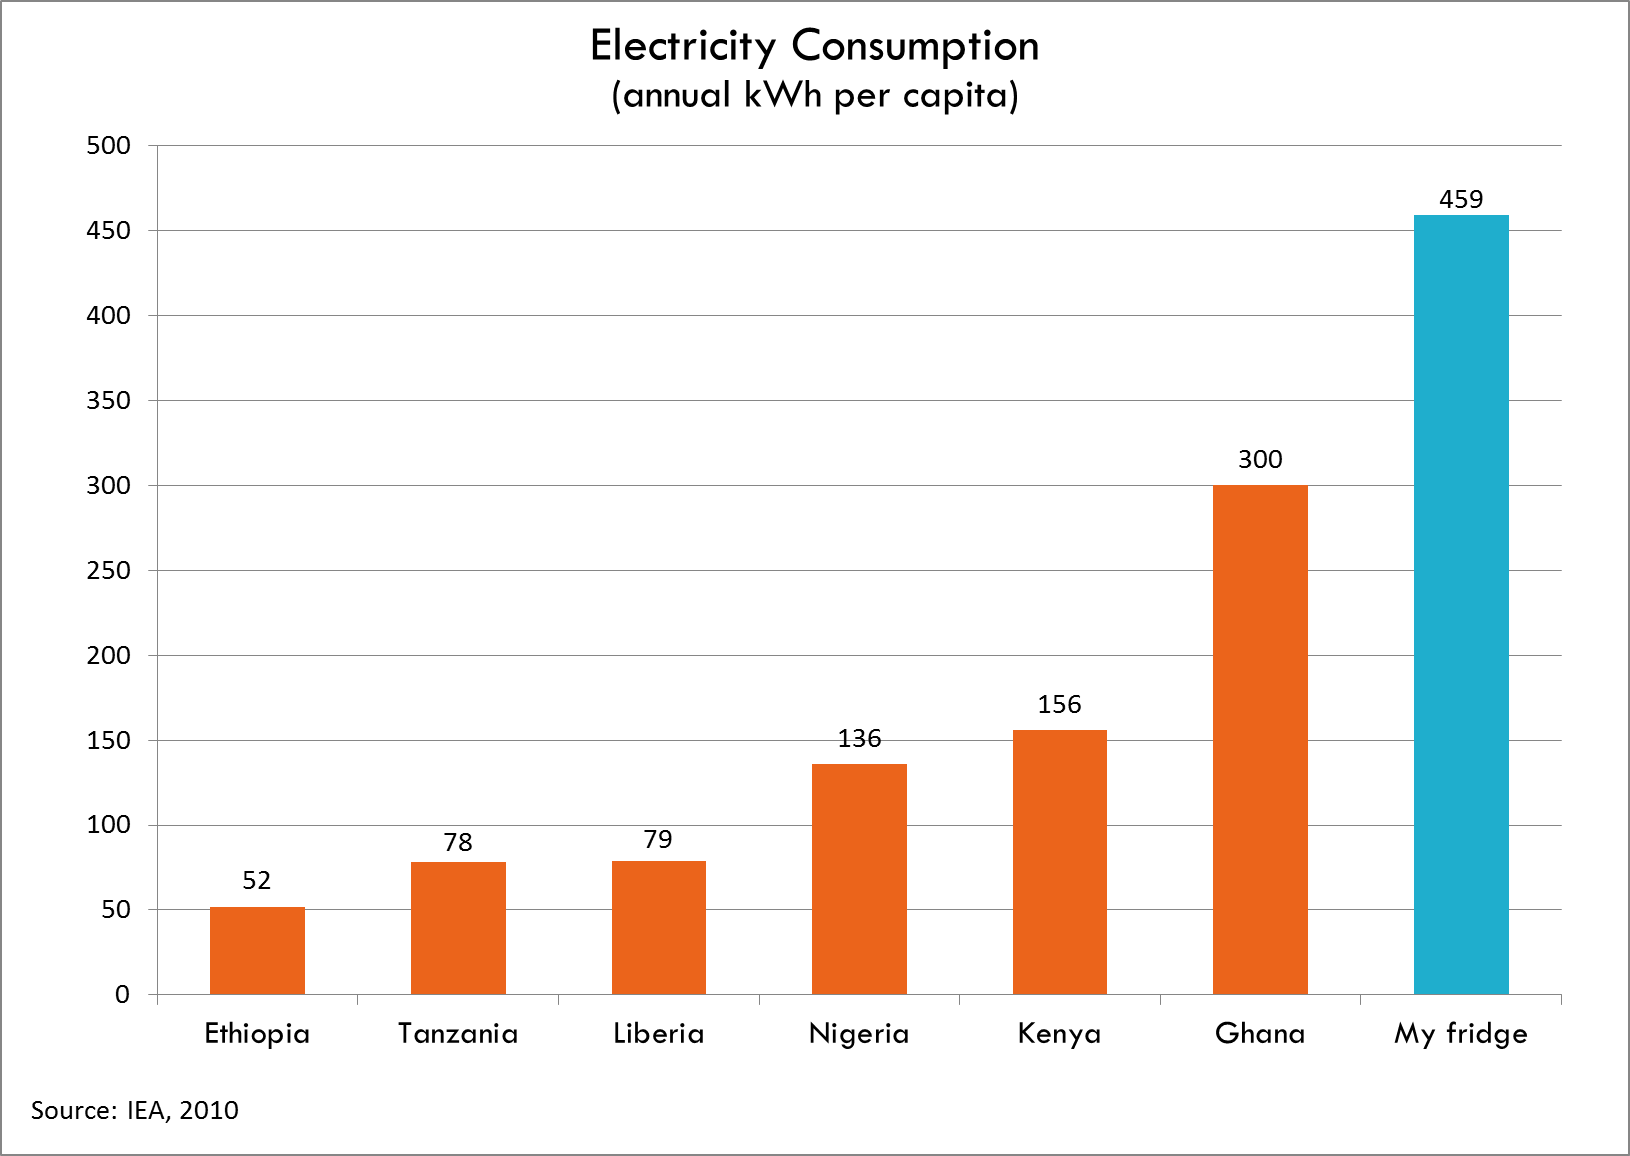
  • Your refrigerator uses more power than many people in AfricaElectricity-consumption-Todd-Moss