February 20, 2013

We can haz margin of error?

Generally good use of survey data in a story from Stuff about the embattled Education Minister.  They even quote a competing poll, which agrees very well with their overall statistic.

The omission, though, relates to the headline figure: “71pc want Parata gone – survey”.  That’s a proportion “among voters from Canterbury”.   Assuming that they don’t mean “voters” in any electorally-relevant sense, just respondents, we would expect about 120 of the 1000 respondents to be from Canterbury. The maximum margin of error is a little under 10%.

The fact that one region has 71% wanting Ms Parata gone when the overall national average is 60% would actually not be all that notable on its own. Since we already expect her to be less popular in ChCh, the difference is worth writing about, but if it’s worth a headline, it’s worth a margin of error.

February 19, 2013

Terminology

Most of the Stats department is currently moving from the leafy park-like north end of campus back to the glass and concrete Tower of Science. While we’re in transit, here’s a bogus poll on statistical terminology.

Distributions can be classified as to whether they produce more outliers or fewer outliers than a normal distribution. The terms are “platykurtic” (same Greek root as platypus, meaning “flat”) and “leptokurtic” (Greek root meaning “thin”)

Update: answer, and potentially discussion, in the comments

International cooperation

Ben Goldacre mentions the current UK discussion over whether Members of Parliament go to prison at a higher rate than people in general.  He points out that age, gender, and social class distributions are different for MPs, and suggests someone does an adjustment.

Here’s a preliminary attempt. Firstly, note that the data (and the claims) have been about prevalence rather than incidence — MPs as a fraction of the UK prison population, not as a fraction of sentences.  I got prison population data from a Parliament briefing paper, and MPs in prison data from Channel 4’s Factcheck

  • I don’t have detailed age data for MPs, though it could certainly be determined, but at least we can restrict from the whole British population to adults (51 million)
  • The UK adult population is very close to 50:50 on gender, 502/648 MPs are male, 63318 out of 66818 (adult) prisoners

So, 0.79% of male MPs were in prison, compared to 0.24% of adult males in the UK. No female MPs, compared to 0.01% for the female population. Gender-standardised, that’s a relative rate of 3.0

The other important variable is social class.  The briefing paper on the prison population says that `almost three-quarters’ of prisoners were on benefits immediately before entry, and Factcheck says 5.5 million people in Britain are on benefits (and presumably MPs aren’t). I don’t have data on how this varies by gender, either for prisoners or for the population, so I’ll do it separately from the gender standardisation

We have 0.61% of MPs (not on benefits) in prison, and one-quarter of 68818 prisoners out of (51 million – 5.5 million) people not on benefits in prison, which comes to 0.037%, for a relative rate of 16.

So, among adults not on benefits, (people who would otherwise be) MPs are 16 times more likely to be in prison.

User fees and road costs

Last month, there was an interesting report from a US group called The Tax Foundation  on the fraction of US state and local road costs contributed by registration fees, tolls, petrol taxes, and other charges for road users.  It turned out to average about 1/3 — that’s just actual monetary costs, not the costs that drivers impose on others through congestion or carbon emissions.

In New Zealand, the fraction for local roads seems to be higher — if you look at the Funding Assistance Rates that say how much the NZ Transport Agency pays toward council road maintenance, operation, and renewal, it varies around roughly 50% (for Wellington, it happens to be 44%). According to NZTA, the rest of the money comes through mechanisms that don’t specifically target drivers, such as council rates.

So, why did I single out the 44% for Wellington? Well, that’s where anyone not at the wheel of a car is apparently a `guest’ on the roads. Or, with unsettling plausibility, `roadkill’.

February 18, 2013

Colour schemes

Two more colour-scheme producers

  • I Want Hue: takes random colours from a user-specified range and uses Science k-means clustering to make them more distinct. Has nice demonstrations on colour theory. 
  • Colorscheme Designer: standard colour-space patterns, user-adjustable. Can show the impact of all the important types of impaired colour vision.

From Twitter #rstats

February 17, 2013

Census time

I just got my census form, so it must be about time to write about the NZ Census.  As I wrote when the West Island had theirs, it’s a good occasion to think about what the census is good for.  You might think that the success of surveys means that the census is no longer necessary, but as landline phones steadily become a less important part of people’s lives, the census (or some substitute) is actually increasingly vital to calibrate surveys.  In fact, part of my research is on the most effective ways of using this sort of information.

The primary problem with surveys is non-response — you can’t get hold of people, or you do catch them and they tell you to get far away and let them have dinner. Good survey organisations have ways to entice people into responding, but they also rely heavily on reweighting: if your survey under-represents families with young children, you can increase the weight given to those you did find, and reduce the bias.

This reweighting technique isn’t perfect, but it really does work.  The world’s largest telephone survey, the US Behavioral Risk Factor Surveillance System, used not to call cellphones.  It now does, providing an opportunity to compare the real cellphone results with the attempts to reweight.  Here are results from Michigan and Utah comparing a basic reweighting approach with a more sophisticated one, for landlines only and for landlines and cellphones. The improved reweighting approach (raking) made a big difference for the landline-only sample, moving it much closer to the landline+cellphone sample. So, reweighting really works.

Reweighting needs good data for the population, so every well-conducted survey from marketing research to opinion polls to the unemployment rate depends on the census, or some substitute.  In Scandinavian countries, the substitute is large administrative databases and record linkage.  We don’t have these, they’d be expensive to set up, and generally in English-speaking countries people don’t want them.  If you don’t have that sort of database, you need either a complete census or a mandatory survey of a random sample of people.

The United States uses both approaches: every ten years they have a complete census as required by the US Constitution, and in between they have the mandatory-response American Community Survey, which samples about 1% of the population each year.  In the US, the American Community Survey is both cheaper and more accurate than adding an extra census at five-year intervals.  In NZ it’s not clear — because of the smaller and more urban population, a sufficiently large survey might not be much less expensive than a five-yearly census.

What we want to avoid is the Canadian approach, where they decided to put nearly all the questions in a new, voluntary survey. The head of Statistics Canada resigned, and while he was forbidden by law to reveal the advice he had given to the government, he could say

I want to take this opportunity to comment on a technical statistical issue which has become the subject of media discussion. This relates to the question of whether a voluntary survey can become a substitute for a mandatory census.

It cannot.


[ps: the National Business Review has a story with quotes from me]
Briefly

  • Reconstructing the path of the Chelyabinsk meteorite in Google Earth
  • Researchers analysing internet commerce randomized trials (re)discover and solve a lot of problems in experimental design (via both Ben Goldacre and Andrew Gelman)
  • From Nature News: stem-cell research in Texas.  The company is outraged by “FDA’s decision to regulate your own stem cells as a drug”. That’s FDA requiring safe manufacturing — the company hasn’t even started clinical trials yet.
  • 80 patient groups sign up to the AllTrials campaign.
February 16, 2013

Visual perception illustration

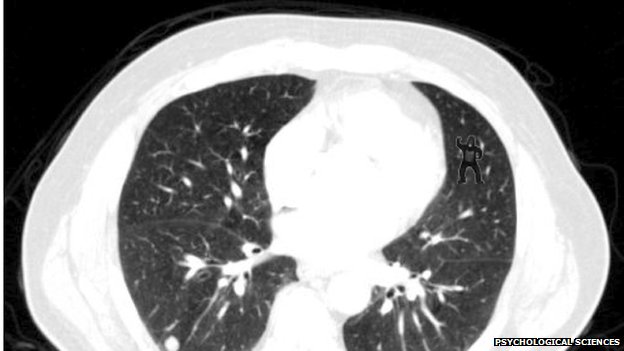
This CT-scan picture illustrates an important perception issue for graphics.  Look carefully at the image, especially at the pattern of white spots.

_65896739_asd

Click through when you’re done
(more…)

Redesigning a graph

There are lots of posts criticizing graphs out there on the internet, and a few that provide an improvement, but not many that show their working.

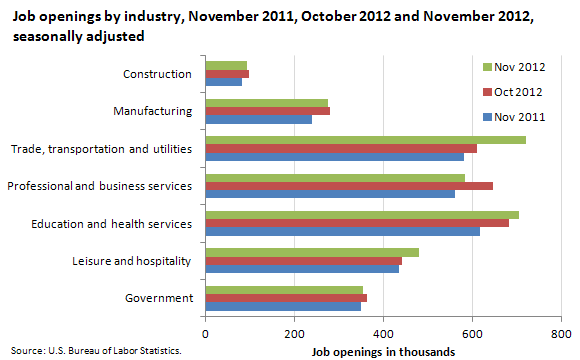
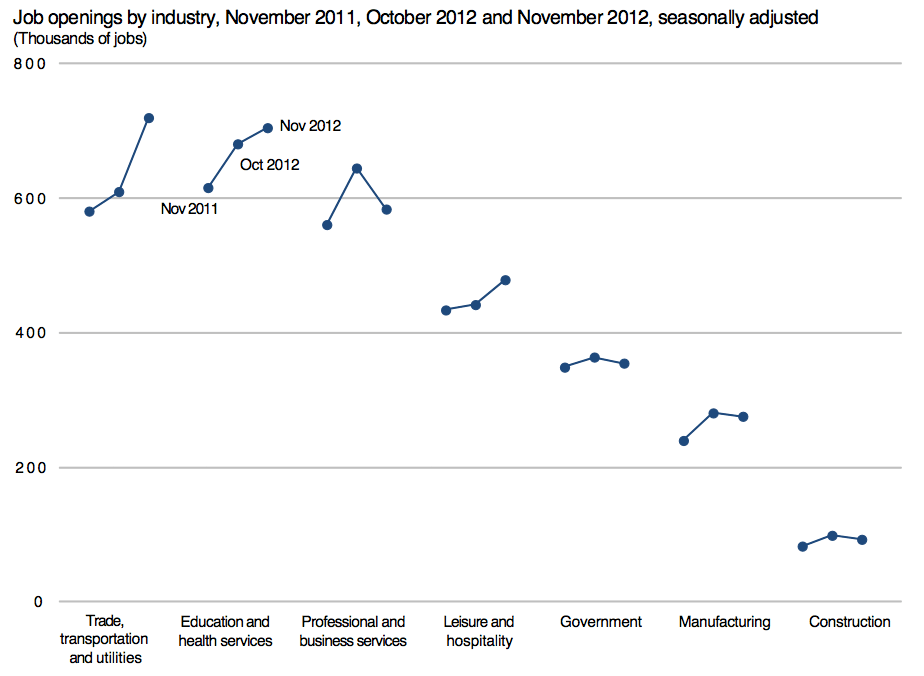
An post at The Why Axis redesigns the jobs chart put out each month by the US Bureau of Labor Statistics, which starts off like this:

ted_20130111

and goes through a number of intermediate versions including this

bls-in4


before the final design.

(thanks to Luis Apiolaza for pointing out The Why Axis on Twitter)

The dose matters

Q: Did you see that beer is healthy now?

A: Well, not exactly

Q: But there’s research and science and everything. Beer has fewer calories than wine.

A: Again, only up to a point.

Q: What? 43 isn’t less than 84 any more?

A: Beer has fewer calories per millilitre, so if you have 1/4 of a 425ml glass of beer, you get fewer calories  than in 100ml of wine.  In my experience, though, most people drink beer in larger units than 1/4 glass.  The calorie content per standard drink is very similar (slightly higher for beer, especially good beer).

Q: Wouldn’t you expect journalists to know a lot about how people usually drink alcohol?

A: That’s certainly the stereotype, but perhaps it’s out of date.

Q: But what about the micronutrients?

A: The press release mentions silicon.  That’s really a sign of desperation. There isn’t complete consensus that silicon even does anything vital in humans,  let alone that anyone is deficient in it.

Q: So where was this research published?

A: One of the websites of the British Beer and Pub Association

Q: So, not  exactly indepedent, peer-reviewed science?

A: Not as such, no.