February 15, 2013

Genuine sasquatch DNA probably not found

There’s been a bunch of publicity recently over claims that Bigfoot really exists and that a group of forensic scientists have the DNA to prove it.

After being rejected from the top journals either because of prejudice and hide-bound conservatism or because of not having any worthwhile evidence, the researchers have managed to publish some results in a peer-reviewed journal. That they set up for the purpose. (unkind scientists on Twitter are making jokes about the next issue, some of which are quite funny)

Ars Technica has the closest to actual information about the paper that I’ve seen, and their analysis sounds right to me. The paper says that the Bigfoot mitochondrial DNA matches humans, so the creature is a hybrid between humans and some unknown primate.  However, the mitochondrial DNA matches are mostly to sequences from Europe and the Middle East, not to Native American sequences, which looks like contamination rather than hybridisation.  Similarly, the results for nuclear DNA should show fairly long sequences matching humans, and other fairly long sequences that look similar to but not identical to other known primates, but they don’t seem to.

The genome data has only been released in PDF format, not in any of the formats that scientists normally use for storing genome sequences. When someone gets around to converting it, and the full surplus power of the world’s sequence matching software is turned loose, the results will be obvious — so the fact this hasn’t happened is not encouraging.

Is this scientific fraud?  Given the real attempts the researchers have made to publish their results, I think we can repeat an answer quoted by physicist Bob Park after the first cold fusion press conference: “Not yet.” And let’s hope it stays that way.
There oughtta be a law

David Farrar (among others) has written about a recent Coroner’s recommendation that high-visibility clothing should be compulsory for cyclists.  As he notes, ” if you are cycling at night you are a special sort of moron if you do not wear hi-vis gear”, but he rightly points out that isn’t the whole issue.

It’s easy to analyse a proposed law as if the only changes that result are those the law intends: everyone will cycle the same way, but they will all be wearing lurid chartreuse studded with flashing lights and will live happily ever after.  But safety laws, like other public-health interventions, need to be assessed on what will actually happen.

Bicycle helmet laws are a standard example.  There is overwhelming evidence that wearing a bicycle helmet reduces the risk of brain injury, but there’s also pretty good evidence that requiring bicycle helmets reduces cycling. Reducing the number of cyclists is bad from an individual-health point of view and also makes cycling less safe for those who remain. It’s not obvious how to optimise this tradeoff, but my guess based on no evidence is that pro-helmet propaganda might be better than helmet laws.

Another example was a proposal by some US airlines to require small children to have their own seat rather than flying in a parent’s lap. It’s clear that having their own seat is safer, but also much more expensive.  If any noticeable fraction of these families ended up driving rather than flying because of the extra cost, the extra deaths on the road would far outweigh those saved in the air.

It’s hard to predict the exact side-effects of a law, but that doesn’t mean they can be ignored any more than the exact side-effects of new medications can be ignored. The problem is that no-one will admit they don’t know the effects of a proposed law.  It took us decades to persuade physicians that they don’t magically know the effects of new treatments; let’s hope it doesn’t take much longer in the policy world.

[PS: yes, I do wear a helmet when cycling, except in the Netherlands, where bikes rule]

Overselling research findings

The Herald has a story claiming that facial proportions indicate racism (in men).  Well, they have a headline claiming that. The story (and the research paper, even more explicitly) pretty much contradicts the headline, and says that facial proportions have nothing to do with racism but indicate whether men write magazine articles about express their racist views or hide them.

If you believe the story, the relationship is very strong

Looking at the photos from the first study, a new group of participants evaluated men with wider, shorter faces as more prejudiced, and they were able to accurately estimate the target’s self-reported prejudicial beliefs just by looking at an image of his face.

and to be fair to the journalist, that’s what the researchers said.  If you look at their actual results, it’s not what they found.

They found an average difference of 1.92 on a 6-point perceived-racism scale for men who differ by 1 unit on the facial proportion scale.  The full range of the facial proportion scale appears to only be about 0.7 units. The paper doesn’t tell us the actual distribution of the measurements, but according to another research paper I found on the internets, the standard deviation of this facial proportion scale is about 0.12.  That means two randomly chosen men would differ by about 0.17 units, and the relationship  would predict a difference in the 6-point perceived-racism scale of about 0.3 units.  The association with self-reported racism was about as strong, though I haven’t been able to find enough information to compute the predicted differences (it shouldn’t be this hard).

In my book, that’s not an “accurate estimate”.


February 14, 2013

Super 15 Predictions, Round 1

Team Ratings for Round 1

Welcome to the new Super Rugby season. This year the predictions have been slightly changed with the help of a student, Joshua Dale. The home ground advantage now is different when both teams are from the same country to when the teams are from different countries. The basic method is described on my Department home page.

The introduction of a new team causes problems. I have arbitrarily assigned a rating of -10 to the Kings. This value worked reasonably well when the Rebels were introduced but obviously there will be uncertainty about games involving the Kings until they have some history.

Here are the team ratings prior to Round 1, along with the ratings at the start of the season.

Current Rating Rating at Season Start Difference
Crusaders 9.03 9.03 0.00
Chiefs 6.98 6.98 -0.00
Sharks 4.57 4.57 0.00
Hurricanes 4.40 4.40 0.00
Stormers 3.34 3.34 0.00
Bulls 2.55 2.55 0.00
Reds 0.46 0.46 -0.00
Brumbies -1.06 -1.06 -0.00
Blues -3.02 -3.02 0.00
Highlanders -3.41 -3.41 -0.00
Waratahs -4.10 -4.10 0.00
Cheetahs -4.16 -4.16 -0.00
Force -9.73 -9.73 0.00
Kings -10.00 -10.00 0.00
Rebels -10.64 -10.64 0.00


Predictions for Round 1

Here are the predictions for Round 1. The prediction is my estimated points difference with a positive margin being a win to the home team, and a negative margin a win to the away team.

Game Date Winner Prediction
1 Rebels vs. Force Feb 15 Rebels 1.60
2 Brumbies vs. Reds Feb 16 Brumbies 1.00


Petty drug users fill NZ homes?

Michelle Gosse points us to a discussion of minor drug crime on Stuff.  The headline “Petty drug users fill New Zealand jails” is definitely off, but most of the rest is just a bit messy.

The primary statistical issue is what epidemiologists call “incidence vs prevalence”, economists call “stocks vs flows”, and point-process mavens call “length-biased sampling”.   Because minor drug offenses lead to short sentences, offenders don’t stay in prison long, and so are a much smaller fraction of the prison population than they are of the court workload.  Specifically, as Michelle calculates, the figures mean there were at most an average of about 400 ‘petty drug users’ in NZ jails over the six years in question, from a prison population of more than 8000.  The ‘petty drug users’ are less than 5% of the prison population.  How much less than 5% is hard to calculate, because there’s a mixture of data on number of people and data on number of charges or offences, which aren’t just one to a customer.

The main point of the story is that lots of people are being prosecuted for minor drug crimes, and that this is dumb.  That, I can certainly agree with.  But one more statistical point is being missed. We get quotes like

The New Zealand Drug Foundation said the figures were alarming and showed the court-focused treatment of minor offenders was not working.

But Justice Minister Judith Collins said all drug offending – no matter how minor – should be dealt with through the criminal justice system.

Looking at the figures, about 3000 people a year are charged with cannabis possession. Based on drug-use survey data, about 385000 people use cannabis sometime during a year, so the criminal justice system is actually missing more than 99% of them.  Or, put another way, the proportion of petty drug users in jails (<5%) is substantially lower than in the NZ population as a whole (>14%).  In order to get convicted, you need to be guilty both of cannabis possession and of coming to the attention of the police.   You don’t need to be very cynical to worry about the impact of differential enforcement of the law.

February 13, 2013

Ordinal graphics

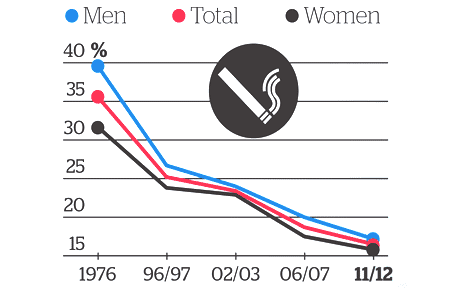
Graphics guru Edward Tufte has the lovely phrase “Pravda School of Ordinal Graphics” for a graphic style which forgets that numbers have a magnitude as well as an order.  Ben Brooks points us to the Herald’s effort


KiwisWhoSmokeFeb13


In the misinformation stakes this is a pretty venial sin, but it’s so unnecessary.  It’s not hard to compute the time lag between 1976 and 1996 or between 2002 and 2006, and to realize they aren’t the same.  The decrease isn’t slowing down as the graph suggests; it’s pretty much a straight line. The truncation of the vertical axis is more of a style thing: if the horizontal axis had been accurate, one could have argued that expanding the vertical scale to show changes in trend was more important. But if that was the rationale, you’d need to get the horizontal scale right.

And if you think of it as an infographic rather than conveying quantitative information there’s another problem: if you have a graphic where two of the colours are pink and blue, and two of the groups are ‘men’ and ‘women’….

Pain and heartbreak

There’s a new paper out in PLoS Medicine that’s starting to show up in overseas news and will probably turn up here soon.  The researchers looked at  painkillers (non-steroidal anti-inflammatory drugs, NSAIDS) that have been shown to increase heart disease risk, and how they are used around the world.

The background here is that NSAIDS block two related enzymes, COX-1 and COX-2.  Blocking COX-2 reduces pain and inflammation; blocking COX-1 decreases blood clotting and leads to gastrointestinal upset and potentially to ulcers.  That’s an obvious reason to look for drugs that just block COX-2, and researchers did this. The best known example is rofecoxib, or as it’s known in marketing, Vioxx.

It turns out that selectively blocking COX-2 is not as good an idea as it seemed, and leads to an increase in heart attacks, strokes, and lawsuits. Vioxx is off the market pretty much everywhere now, but there are some older NSAIDS that were popular because they caused less stomach irritation, and these also turn out to be selective blockers of COX-2. In the light of what was seen for Vioxx and Celebrex, you might expect these drugs also to increase heart attack risk, and the new paper summarises randomised trial data that shows they probably do.  The most important example is diclofenac, which is apparently the world’s most popular painkiller. It’s certainly one of the most popular in New Zealand pharmacies, where it’s called Voltaren.

The research paper estimates that diclofenac increases heart attack risk by about 40% while you’re taking it.  They don’t know how long you need to take it before the risk increases, but if the side-effect is related to blood clotting, it’s plausible that the risk is more or less immediate. The researchers argue that diclofenac should be banned, which seems a bit extreme; the increased heart attack risk is a real issue for some users, but not necessarily for others.  If you’re a 30-year old athlete training every day, your heart attack risk is roughly zero, so increasing it by a factor of 1.4 isn’t a big deal, and the lower risk of stomach irritation might well be worth it.  On the other hand, a lot of people who take NSAIDS regularly for arthritis are at relatively high risk of heart attack and so their risk/benefit tradeoff is very much against diclofenac.

The real problem here is that no-one thought to do any thorough studies of long-term safety for these drugs when they were developed.  Even for the new COX-2 inhibitors such as rofecoxib and celecoxib, the trials that told us about cardiovascular risk were mostly being done not for safety but to look for other potential (but not actual) benefits in Alzheimer’s Disease or in colon cancer prevention.  The world’s regulatory agencies are pretty good at making sure that drugs don’t get approved unless they work, but the regulation of safety is a lot more difficult and is done a lot less well.

[ps: environmentalists may recall that diclofenac is also really bad for vultures]

[Update: now in Stuff, and the Herald]

February 12, 2013

Unclear on the pie-chart concept

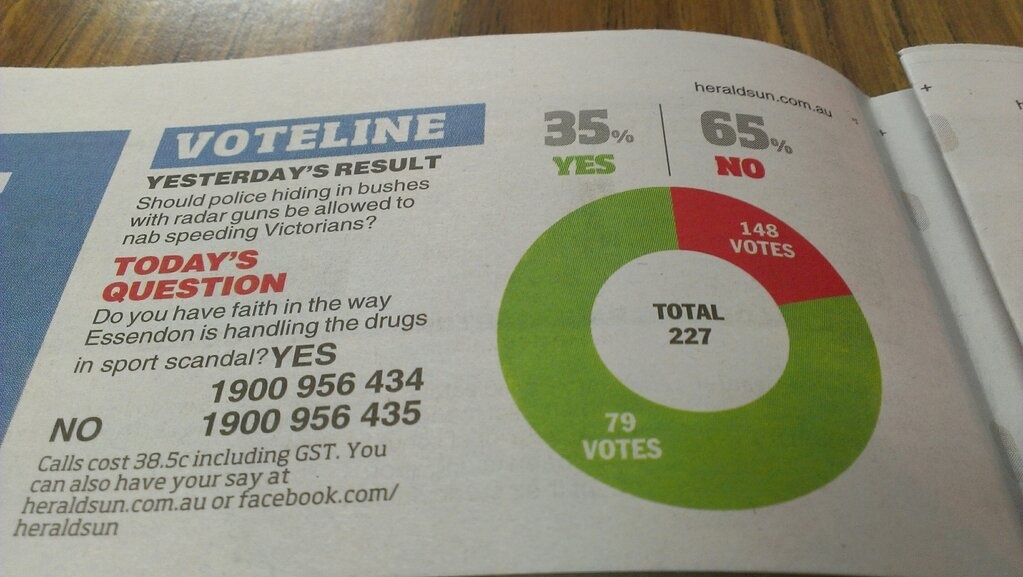
Everyone recognises pie. Everyone likes pie. So pie must be a good representation of numbers, right?

One important detail: you want bigger numbers to translate into more pie. This would be especially important if the numbers meant anything, but it’s not a good look even if they don’t.

4XMQKnz

From the Herald-Sun, via Juha Saarinen on Twitter.

[Also: could a cynical reader perhaps think the question was a bit slanted?]

[Update: this looks like exactly the same pie chart they used for 56% vs 44% last month]

Bogus poll ballot-box stuffing

From Ubermotive.com, an Australian blog

Last week, News Corporation ran a story about the shock results of an online poll that indicated over 90% of the 16,000 respondents wanted to see a raise in speed limits, despite the poll being paired with an article asking motorists to slow down in consideration for elderly drivers.

Well, I have some news for you: Over 15,000 of those votes were mine.

Also see the ABC Mediawatch story.

Everyone seems to think News Corporation should be worried, or at least embarrassed, but if you pay any attention to bogus polls you’ve already given up on the idea that public opinion is real and important and measurable.

In related news, the Assocation of Market Research Organisations has just released another draft of their Guidelines on Political Polling.  Their website currently just has the December draft, but I assume the new draft will be there soon.  The guidelines look sensible to me, with my only reservation being the attempt to maintain a “poll” vs “survey” distinction, where “poll” means a real poll and “survey” means a possibly bogus poll.

Conditional probabilities

Usually when someone confuses the probability of A given B and the probability of B given A they don’t really understand that these are different, and you have to point it out and explain it carefully. Richard David Prosser manages to be self-refuting,

And he added: “If you are a young male, aged between say about 19 and about 35, and you’re a Muslim, or you look like a Muslim, or you come from a Muslim country, then you are not welcome to travel on any of the West’s airlines…”

He accepted that most Muslims are not terrorists, but said it’s “equally undeniable” that “most terrorists are Muslims”.

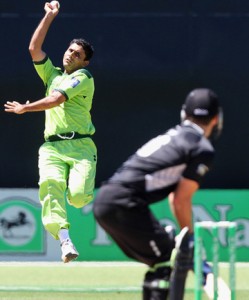
actually pointing out himself that p(terrorist|Muslim) and p(Muslim|terrorist) are not remotely similar.  In the same way, although most members of the Pakistan cricket team are Muslims, most Muslims are not members of the Pakistan cricket team.

That doesn’t handle the further pointless complication of ‘people who look like Muslims’, who, as far as I have been able to tell, are not over-represented among terrorists, but this site might be helpful for calibration.