February 18, 2020

Rugby Premiership Predictions for Round 11

Team Ratings for Round 11

The basic method is described on my Department home page.
Here are the team ratings prior to this week’s games, along with the ratings at the start of the season.

Current Rating Rating at Season Start Difference
Saracens 10.13 9.34 0.80
Exeter Chiefs 8.06 7.99 0.10
Sale Sharks 3.60 0.17 3.40
Northampton Saints 0.91 0.25 0.70
Gloucester 0.84 0.58 0.30
Bath 0.19 1.10 -0.90
Bristol -1.24 -2.77 1.50
Harlequins -2.20 -0.81 -1.40
Wasps -2.34 0.31 -2.70
Leicester Tigers -2.65 -1.76 -0.90
London Irish -4.11 -5.51 1.40
Worcester Warriors -4.97 -2.69 -2.30


Performance So Far

So far there have been 60 matches played, 41 of which were correctly predicted, a success rate of 68.3%.
Here are the predictions for last week’s games.

Game Date Score Prediction Correct
1 Gloucester vs. Exeter Chiefs Feb 15 15 – 26 -1.70 TRUE
2 Harlequins vs. London Irish Feb 15 15 – 29 8.70 FALSE
3 Leicester Tigers vs. Wasps Feb 15 18 – 9 3.50 TRUE
4 Northampton Saints vs. Bristol Feb 15 14 – 20 8.20 FALSE
5 Saracens vs. Sale Sharks Feb 15 36 – 22 10.50 TRUE
6 Worcester Warriors vs. Bath Feb 15 21 – 22 -0.60 TRUE


Predictions for Round 11

Here are the predictions for Round 11. The prediction is my estimated expected points difference with a positive margin being a win to the home team, and a negative margin a win to the away team.

Game Date Winner Prediction
1 Bath vs. Harlequins Feb 22 Bath 6.90
2 Bristol vs. Worcester Warriors Feb 22 Bristol 8.20
3 Exeter Chiefs vs. Northampton Saints Feb 22 Exeter Chiefs 11.70
4 London Irish vs. Gloucester Feb 22 Gloucester -0.40
5 Sale Sharks vs. Leicester Tigers Feb 22 Sale Sharks 10.70
6 Wasps vs. Saracens Feb 22 Saracens -8.00


Pro14 Predictions for Round 12

Team Ratings for Round 12

The basic method is described on my Department home page.
Here are the team ratings prior to this week’s games, along with the ratings at the start of the season.

Current Rating Rating at Season Start Difference
Leinster 16.23 12.20 4.00
Munster 8.93 10.73 -1.80
Glasgow Warriors 7.08 9.66 -2.60
Edinburgh 5.28 1.24 4.00
Ulster 4.71 1.89 2.80
Scarlets 3.01 3.91 -0.90
Connacht 1.25 2.68 -1.40
Cheetahs -0.16 -3.38 3.20
Cardiff Blues -0.39 0.54 -0.90
Ospreys -3.27 2.80 -6.10
Treviso -4.04 -1.33 -2.70
Dragons -8.38 -9.31 0.90
Zebre -14.89 -16.93 2.00
Southern Kings -15.35 -14.70 -0.70


Performance So Far

So far there have been 76 matches played, 58 of which were correctly predicted, a success rate of 76.3%.
Here are the predictions for last week’s games.

Game Date Score Prediction Correct
1 Glasgow Warriors vs. Zebre Feb 15 56 – 24 27.70 TRUE
2 Munster vs. Southern Kings Feb 15 68 – 3 28.50 TRUE
3 Leinster vs. Cheetahs Feb 16 36 – 12 22.60 TRUE
4 Scarlets vs. Edinburgh Feb 16 9 – 14 5.10 FALSE
5 Ospreys vs. Ulster Feb 16 26 – 24 -2.20 FALSE
6 Connacht vs. Cardiff Blues Feb 16 29 – 0 6.50 TRUE


Predictions for Round 12

Here are the predictions for Round 12. The prediction is my estimated expected points difference with a positive margin being a win to the home team, and a negative margin a win to the away team.

Game Date Winner Prediction
1 Ospreys vs. Leinster Feb 22 Leinster -13.00
2 Edinburgh vs. Connacht Feb 22 Edinburgh 10.50
3 Zebre vs. Munster Feb 22 Munster -17.30
4 Glasgow Warriors vs. Dragons Feb 23 Glasgow Warriors 22.00
5 Ulster vs. Cheetahs Feb 23 Ulster 11.40
6 Cardiff Blues vs. Treviso Feb 24 Cardiff Blues 10.20
7 Scarlets vs. Southern Kings Feb 24 Scarlets 24.90


Pro14 Predictions for Round 11

Team Ratings for Round 11

I missed posting predictions for this round thinking that there was a longer break between games. Because I use an algorithm and code and no subjective analysis, these predictions are exactly what I would have posted and I am posting them now for completeness.

The basic method is described on my Department home page.
Here are the team ratings prior to this week’s games, along with the ratings at the start of the season.

Current Rating Rating at Season Start Difference
Leinster 16.11 12.20 3.90
Munster 7.81 10.73 -2.90
Glasgow Warriors 6.69 9.66 -3.00
Ulster 5.09 1.89 3.20
Edinburgh 4.82 1.24 3.60
Scarlets 3.47 3.91 -0.40
Connacht 0.45 2.68 -2.20
Cardiff Blues 0.41 0.54 -0.10
Cheetahs -0.03 -3.38 3.30
Ospreys -3.65 2.80 -6.50
Treviso -4.04 -1.33 -2.70
Dragons -8.38 -9.31 0.90
Southern Kings -14.24 -14.70 0.50
Zebre -14.51 -16.93 2.40


Performance So Far

So far there have been 70 matches played, 54 of which were correctly predicted, a success rate of 77.1%.
Here are the predictions for last week’s games.

Game Date Score Prediction Correct
1 Cheetahs vs. Southern Kings 45 – 0 17.40 TRUE


Predictions for Round 11

Here are the predictions for Round 11. The prediction is my estimated expected points difference with a positive margin being a win to the home team, and a negative margin a win to the away team.

Game Date Winner Prediction
1 Glasgow Warriors vs. Zebre Glasgow Warriors 27.70
2 Munster vs. Southern Kings Munster 28.50
3 Leinster vs. Cheetahs Leinster 22.60
4 Scarlets vs. Edinburgh Scarlets 5.10
5 Ospreys vs. Ulster Ulster -2.20
6 Connacht vs. Cardiff Blues Connacht 6.50


February 11, 2020

Super Rugby Predictions for Round 3


Team Ratings for Round 3

The basic method is described on my Department home page.
Here are the team ratings prior to this week’s games, along with the ratings at the start of the season.

Current Rating Rating at Season Start Difference
Crusaders 15.36 17.10 -1.70
Jaguares 7.64 7.23 0.40
Hurricanes 7.59 8.79 -1.20
Chiefs 7.56 5.91 1.70
Highlanders 2.44 4.53 -2.10
Stormers 1.97 -0.71 2.70
Sharks 1.73 -0.87 2.60
Brumbies 1.19 2.01 -0.80
Blues 0.99 -0.04 1.00
Bulls 0.05 1.28 -1.20
Lions -1.08 0.39 -1.50
Waratahs -3.42 -2.48 -0.90
Reds -4.88 -5.86 1.00
Rebels -8.64 -7.84 -0.80
Sunwolves -17.51 -18.45 0.90


Performance So Far

So far there have been 14 matches played, 8 of which were correctly predicted, a success rate of 57.1%.
Here are the predictions for last week’s games.

Game Date Score Prediction Correct
1 Highlanders vs. Sharks Feb 07 20 – 42 10.90 FALSE
2 Brumbies vs. Rebels Feb 07 39 – 26 14.60 TRUE
3 Chiefs vs. Crusaders Feb 08 25 – 15 -5.40 FALSE
4 Waratahs vs. Blues Feb 08 12 – 32 4.80 FALSE
5 Lions vs. Reds Feb 08 27 – 20 10.40 TRUE
6 Stormers vs. Bulls Feb 08 13 – 0 5.00 TRUE
7 Jaguares vs. Hurricanes Feb 08 23 – 26 7.50 FALSE


Predictions for Round 3

Here are the predictions for Round 3. The prediction is my estimated expected points difference with a positive margin being a win to the home team, and a negative margin a win to the away team.

Game Date Winner Prediction
1 Blues vs. Crusaders Feb 14 Crusaders -9.90
2 Rebels vs. Waratahs Feb 14 Waratahs -0.70
3 Sunwolves vs. Chiefs Feb 15 Chiefs -19.10
4 Hurricanes vs. Sharks Feb 15 Hurricanes 11.90
5 Brumbies vs. Highlanders Feb 15 Brumbies 4.80
6 Lions vs. Stormers Feb 15 Lions 1.50
7 Jaguares vs. Reds Feb 15 Jaguares 18.50


February 4, 2020

Super Rugby Predictions for Round 2

Team Ratings for Round 2

The basic method is described on my Department home page.
Here are the team ratings prior to this week’s games, along with the ratings at the start of the season.

Current Rating Rating at Season Start Difference
Crusaders 16.42 17.10 -0.70
Jaguares 8.39 7.23 1.20
Hurricanes 6.84 8.79 -2.00
Chiefs 6.50 5.91 0.60
Highlanders 4.53 4.53 0.00
Brumbies 1.34 2.01 -0.70
Stormers 1.24 -0.71 1.90
Bulls 0.77 1.28 -0.50
Sharks -0.36 -0.87 0.50
Blues -0.63 -0.04 -0.60
Lions -0.77 0.39 -1.20
Waratahs -1.80 -2.48 0.70
Reds -5.19 -5.86 0.70
Rebels -8.79 -7.84 -0.90
Sunwolves -17.51 -18.45 0.90


Performance So Far

So far there have been 7 matches played, 5 of which were correctly predicted, a success rate of 71.4%.
Here are the predictions for last week’s games.

Game Date Score Prediction Correct
1 Blues vs. Chiefs Jan 31 29 – 37 -1.40 TRUE
2 Brumbies vs. Reds Jan 31 27 – 24 12.40 TRUE
3 Sharks vs. Bulls Jan 31 23 – 15 2.40 TRUE
4 Sunwolves vs. Rebels Feb 01 36 – 27 -4.60 FALSE
5 Crusaders vs. Waratahs Feb 01 43 – 25 25.60 TRUE
6 Stormers vs. Hurricanes Feb 01 27 – 0 -3.50 FALSE
7 Jaguares vs. Lions Feb 01 38 – 8 12.80 TRUE


Predictions for Round 2

Here are the predictions for Round 2. The prediction is my estimated expected points difference with a positive margin being a win to the home team, and a negative margin a win to the away team.

Game Date Winner Prediction
1 Highlanders vs. Sharks Feb 07 Highlanders 10.90
2 Brumbies vs. Rebels Feb 07 Brumbies 14.60
3 Chiefs vs. Crusaders Feb 08 Crusaders -5.40
4 Waratahs vs. Blues Feb 08 Waratahs 4.80
5 Lions vs. Reds Feb 08 Lions 10.40
6 Stormers vs. Bulls Feb 08 Stormers 5.00
7 Jaguares vs. Hurricanes Feb 08 Jaguares 7.50


February 2, 2020

Graphs don’t matter?

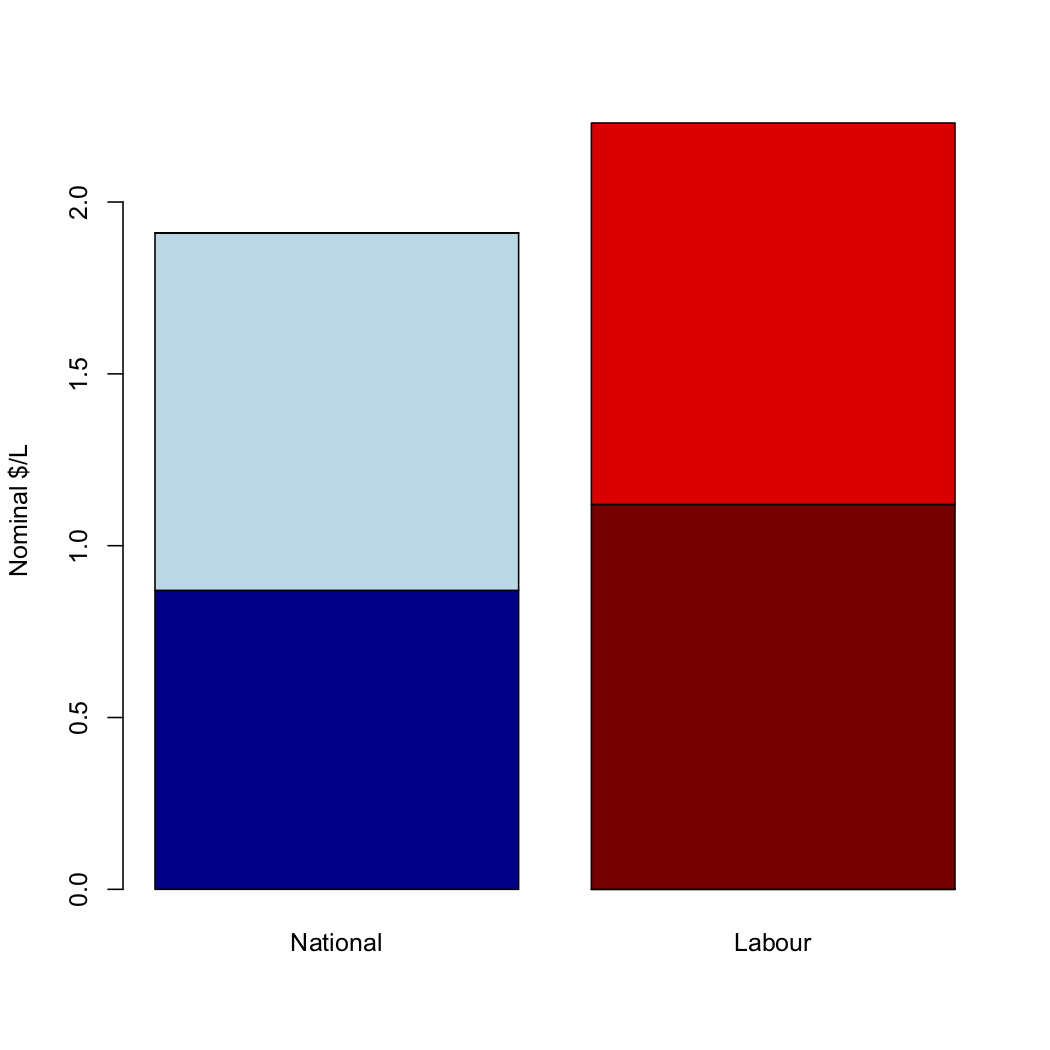
Back in early December, I wrote about a political ad authorised by Simon Bridges, showing the price of fuel.

As I said the, the numbers do not remotely match the graph.  A graph using those numbers would look more like

Dylan Reeve and other people complained to the Advertising Standards Authority, both about the graph itself and about the choice of numbers, which (in his opinion and mine) was cherrypicked in a misleading way.

The ASA decided (in a split decision) that the graphic was not misleading

The majority said the data displayed was correct which saved the hyperbolic graphic from being misleading, given the political medium used and the principles of advocacy advertising.

I believe this is decision is bad in terms of norms for mainstream political advertising, and that it’s likely to be factually incorrect as to the impact of the graphic.

The cherrypicked numbers are misleading, but they are misleading in a way that is, sadly, routine in political advertising.  I’ve written about examples from both parties here since StatsChat started. My starting point for any political advocacy involving numerical comparisons is always that the numbers are likely to be correct as quoted, but chosen to mislead. Given the established norms,  I can understand the ASA not wanting to get involved.

The distorted graph, on the other hand, seems to be new.  I was genuinely surprised at the extent of the distortion — well beyond common tricks of perspective or false baseline.

If writing the numbers on a misleading graph was enough to stop it being misleading, there would be no point having data graphics.  The whole point of data graphics is that they provide a clearer and more forceful impression of the data than just tabulating the numbers.  Misleading graphs are misleading.

January 29, 2020

Pro14 Predictions for Round 9 Delayed Match

Team Ratings for Round 9 Delayed Match

The basic method is described on my Department home page.
Here are the team ratings prior to this week’s games, along with the ratings at the start of the season.

Current Rating Rating at Season Start Difference
Leinster 16.11 12.20 3.90
Munster 7.81 10.73 -2.90
Glasgow Warriors 6.69 9.66 -3.00
Ulster 5.09 1.89 3.20
Edinburgh 4.82 1.24 3.60
Scarlets 3.47 3.91 -0.40
Connacht 0.45 2.68 -2.20
Cardiff Blues 0.41 0.54 -0.10
Cheetahs -0.95 -3.38 2.40
Ospreys -3.65 2.80 -6.50
Treviso -4.04 -1.33 -2.70
Dragons -8.38 -9.31 0.90
Southern Kings -13.32 -14.70 1.40
Zebre -14.51 -16.93 2.40


Performance So Far

So far there have been 69 matches played, 53 of which were correctly predicted, a success rate of 76.8%.
Here are the predictions for last week’s games.

Game Date Score Prediction Correct
1 Southern Kings vs. Cheetahs Jan 26 30 – 31 -8.80 TRUE


Predictions for Round 9 Delayed Match

Here are the predictions for Round 9 Delayed Match. The prediction is my estimated expected points difference with a positive margin being a win to the home team, and a negative margin a win to the away team.

Game Date Winner Prediction
1 Cheetahs vs. Southern Kings Feb 02 Cheetahs 17.40


Rugby Premiership Predictions for Round 10

Team Ratings for Round 10

The basic method is described on my Department home page.
Here are the team ratings prior to this week’s games, along with the ratings at the start of the season.

Current Rating Rating at Season Start Difference
Saracens 9.84 9.34 0.50
Exeter Chiefs 7.53 7.99 -0.50
Sale Sharks 3.88 0.17 3.70
Northampton Saints 1.67 0.25 1.40
Gloucester 1.37 0.58 0.80
Bath 0.16 1.10 -0.90
Harlequins -1.06 -0.81 -0.30
Bristol -2.00 -2.77 0.80
Wasps -2.00 0.31 -2.30
Leicester Tigers -2.99 -1.76 -1.20
Worcester Warriors -4.94 -2.69 -2.30
London Irish -5.24 -5.51 0.30


Performance So Far

So far there have been 54 matches played, 37 of which were correctly predicted, a success rate of 68.5%.
Here are the predictions for last week’s games.

Game Date Score Prediction Correct
1 Bath vs. Leicester Tigers Jan 25 13 – 10 8.30 TRUE
2 Bristol vs. Gloucester Jan 25 34 – 16 -0.80 FALSE
3 Exeter Chiefs vs. Sale Sharks Jan 25 19 – 22 9.50 FALSE
4 Harlequins vs. Saracens Jan 25 41 – 14 -9.80 FALSE
5 Northampton Saints vs. London Irish Jan 25 16 – 20 13.20 FALSE
6 Worcester Warriors vs. Wasps Jan 25 26 – 30 2.30 FALSE


Predictions for Round 10

Here are the predictions for Round 10. The prediction is my estimated expected points difference with a positive margin being a win to the home team, and a negative margin a win to the away team.

Game Date Winner Prediction
1 Gloucester vs. Exeter Chiefs Feb 15 Exeter Chiefs -1.70
2 Harlequins vs. London Irish Feb 15 Harlequins 8.70
3 Leicester Tigers vs. Wasps Feb 15 Leicester Tigers 3.50
4 Northampton Saints vs. Bristol Feb 15 Northampton Saints 8.20
5 Saracens vs. Sale Sharks Feb 15 Saracens 10.50
6 Worcester Warriors vs. Bath Feb 15 Bath -0.60


Briefly

January 26, 2020

Coronavirus news

One reputable source of moderately technical information about the new coronavirus is the MRC Centre for Global Infectious Disease Analysis, at Imperial College, London.  They’ve worked on outbreak modelling and control advice for a long time, across a wide range of epidemics (including both previous coronavirus outbreaks: SARS and MERS).

Their latest (third) report says that it’s clear there has been sustained person-to-person transmission — a spreading epidemic — in China, and that basically nothing else is clear.

From the Discussion section

Whether transmission continues at the same rate now critically depends on the effectiveness of the intense control effort now underway in Wuhan and across China. We note the large body of evidence that suggests that the reproduction number for SARS changed considerably when populations became fully aware of the threat. If a similar change to contact patterns is occurring in this outbreak, rates of transmission are likely to be lower now than during the period for which these estimates were made, due to control measures and risk avoidance in the population. Whether the reduction in transmission is sufficient to reduce R to below 1–and thus end the outbreak –remains to be seen. Reports point to mildly symptomatic but infectious cases of 2019-nCoV, which were not a feature of SARS. Prompt detection and isolation of such cases will be extremely challenging, given the larger number of other diseases (e.g. influenza) which can cause such non-specific respiratory symptoms.While more severe cases will always need to be prioritised, control may depend upon successful detection, testing and isolation of suspect cases with the broadest possible range of symptom severity.Our results emphasise the need to track transmission rates over the next few weeks, especially in Wuhan. If a clear downwards trend is observed in the numbers of new cases, that would indicate that control measures and behavioural changes can substantially reduce the transmissibility of 2019-nCoV. Genetic data from Wuhan after the implementation of strong public health measures may also provide valuable insight into the patterns and rate of transmission.

Despite the recent decision of the WHO Emergency Committee to not declare this a Public Health Emergency of International Concern at this time, this epidemic represents a clear and ongoing global health threat. It is uncertain at the current time whether it is possible to contain the continuing epidemic within China. In addition to monitoring how the epidemic evolves, it is critical that the magnitude of the threat is better understood. Currently, we have only a limited understanding of the spectrum of severity of symptoms that infection with this virus causes, and no reliable estimates of the case fatality ratio –the proportion of cases who will die as a result of the disease. Characterising the severity spectrum, and how severity of symptoms relates to infectiousness, will be critical to evaluating the feasibility of control and the likely public health impact of this epidemic.

When they talk about ‘containing’ the epidemic within China, they don’t mean whether or not there are cases outside China — there are already are — they mean whether or not there’s sustained transmission from person to person outside China.